by Rami Abu-Draa | Jan 16, 2026 | Tecchnical Analysis
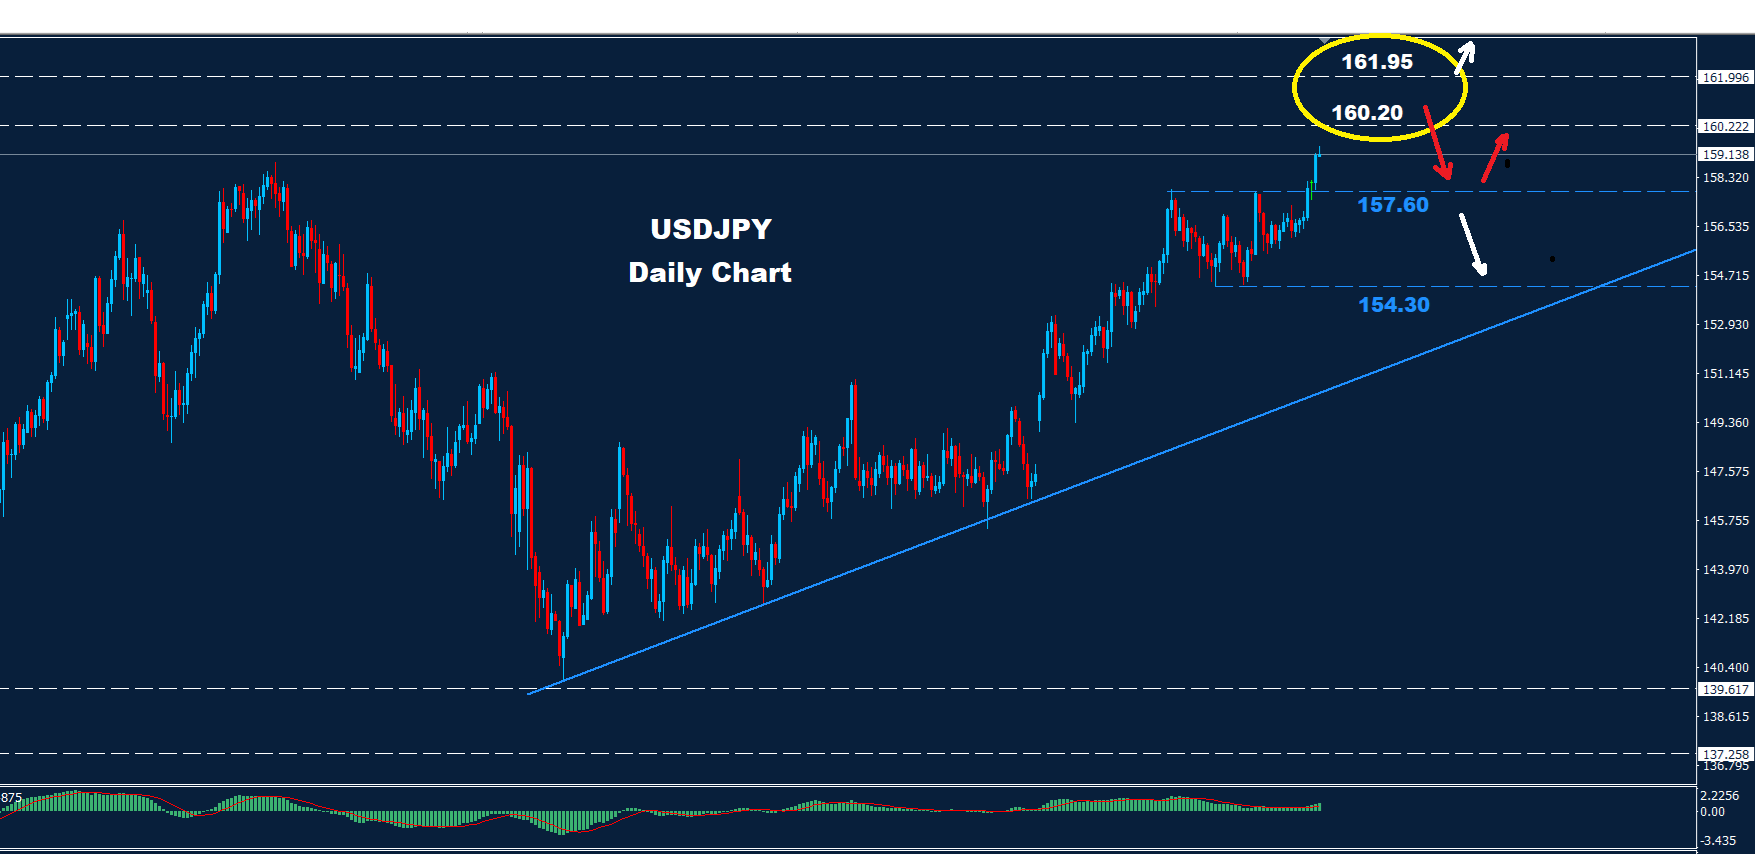
USDJPY hit 158.95 and closed from the target at 159.85. As we see over the chart, the short-term outlook is towards the resistance zone of 160.20 – 161.95 as a potential risk to push the market for a correction towards 157.50 or 154.30. However, the Intraday chart...
by Rami Abu-Draa | Jan 16, 2026 | Tecchnical Analysis
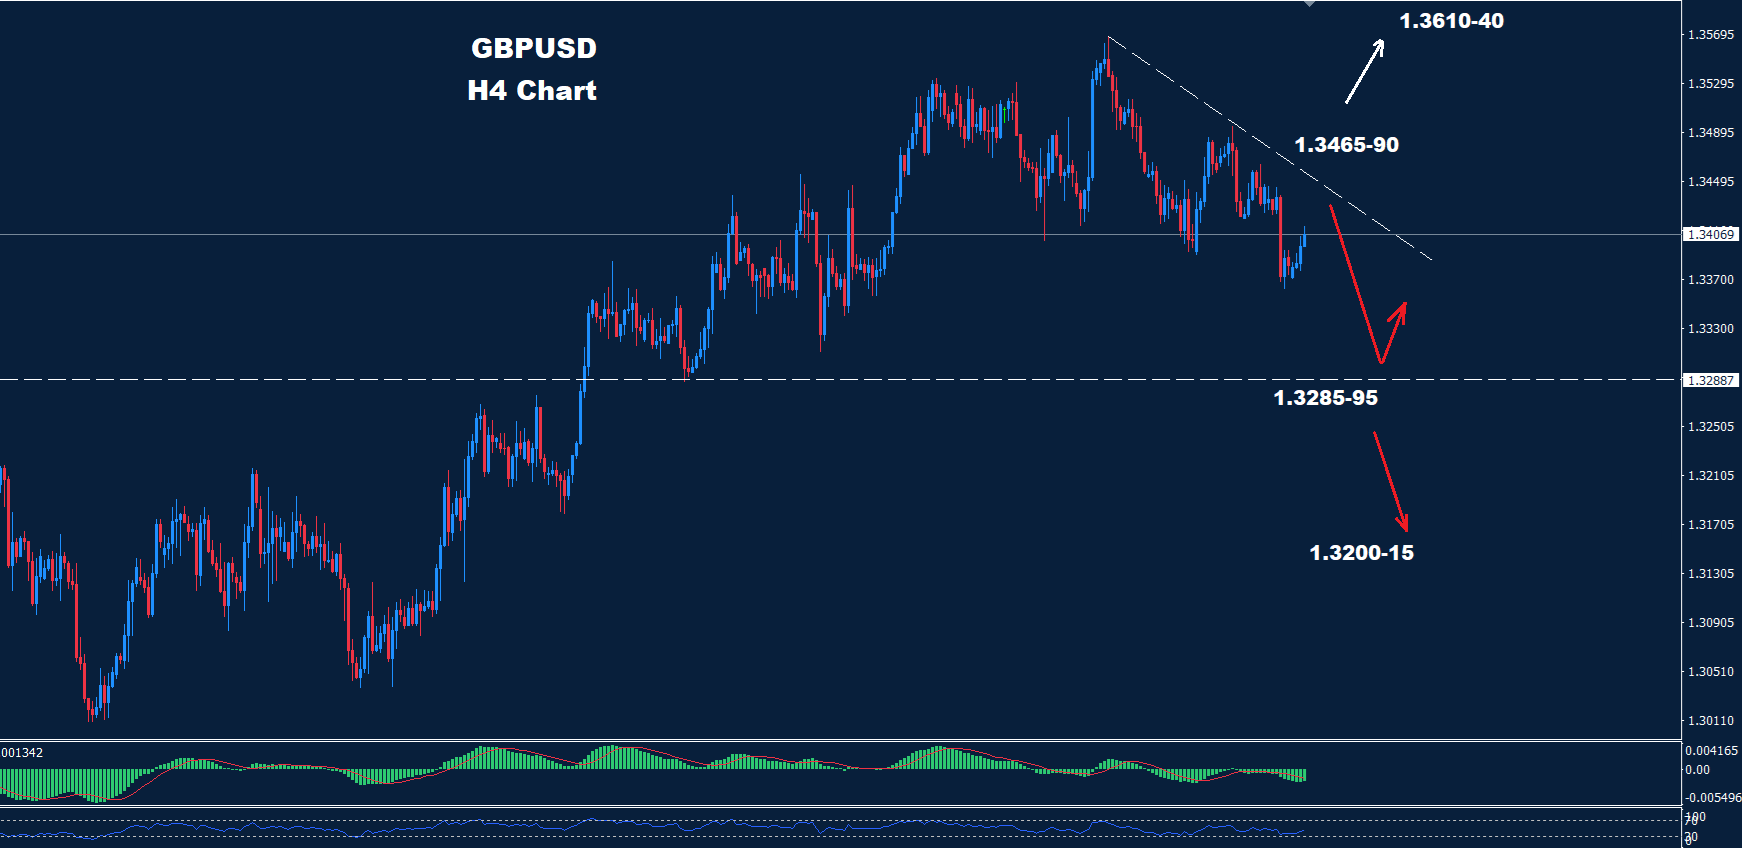
GBPUSD managed to print below the support of 1.3400 which could lead to more pressure over the market. As we see over the chart, prices face resistance around 1.3465-90, where as long as the market holds below it, more of a drop will be expected toward the 1.3285-95...
by Rami Abu-Draa | Jan 16, 2026 | Tecchnical Analysis
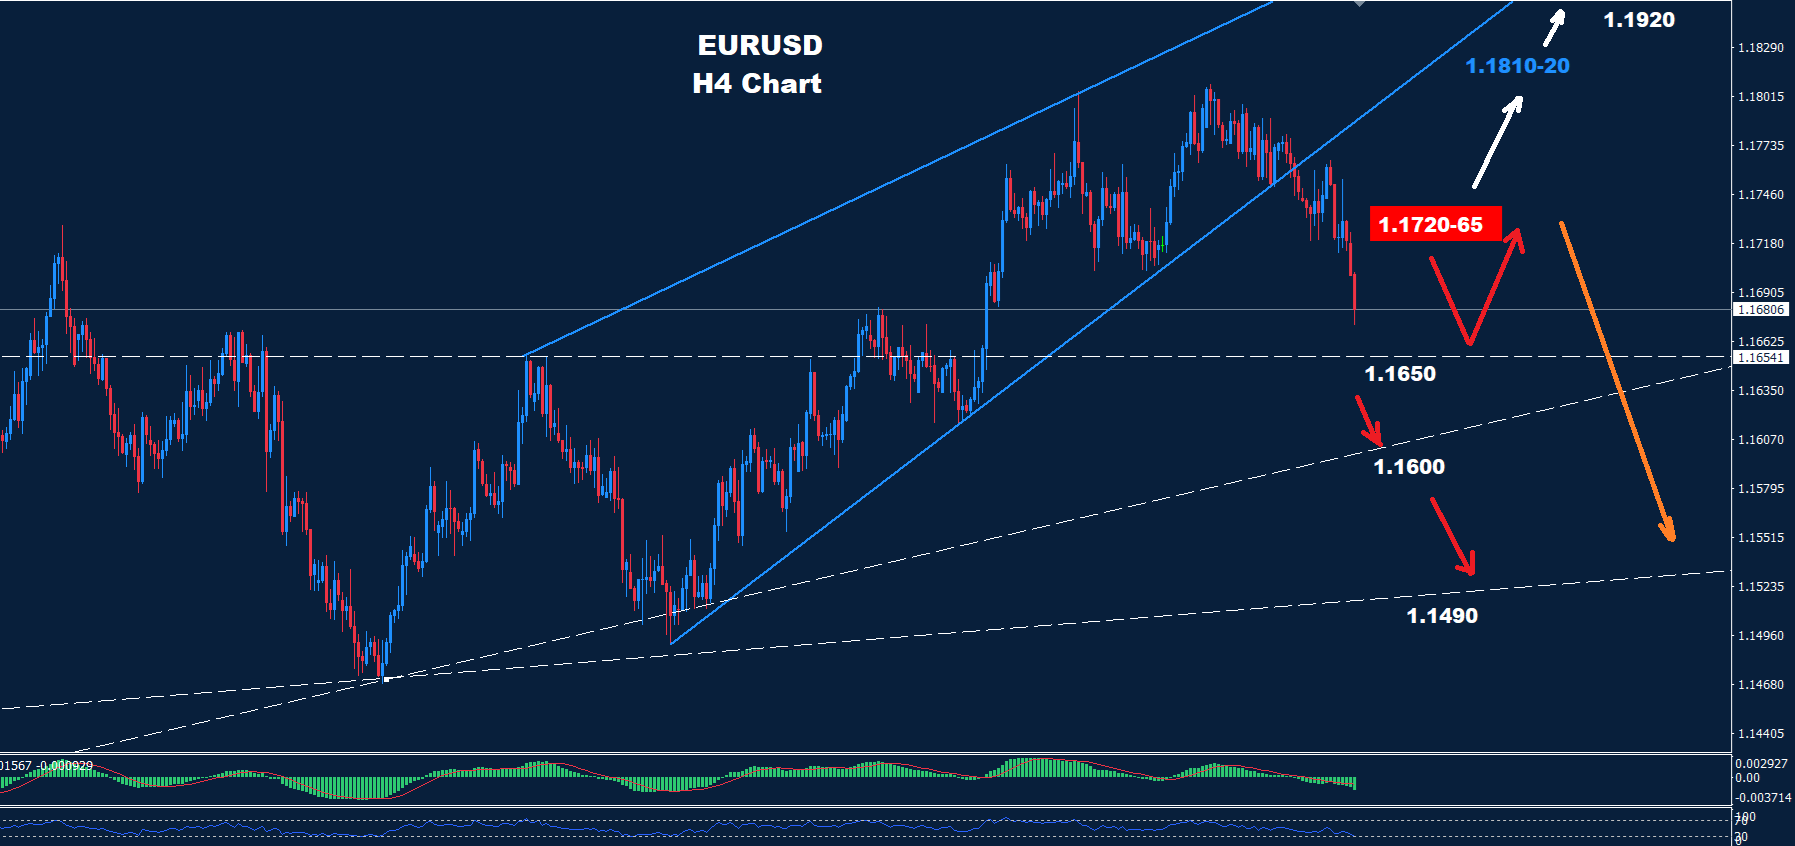
EURUSD broke a Rising Wedge formation which could create some pressure towards 1.1490. As we see from the previous chart, prices still face a support zone at 1.1600 which could lead to another advance higher. Below 1.1600 more of a drop toward 1.1490 will be...
by Rami Abu-Draa | Jan 15, 2026 | Tecchnical Analysis
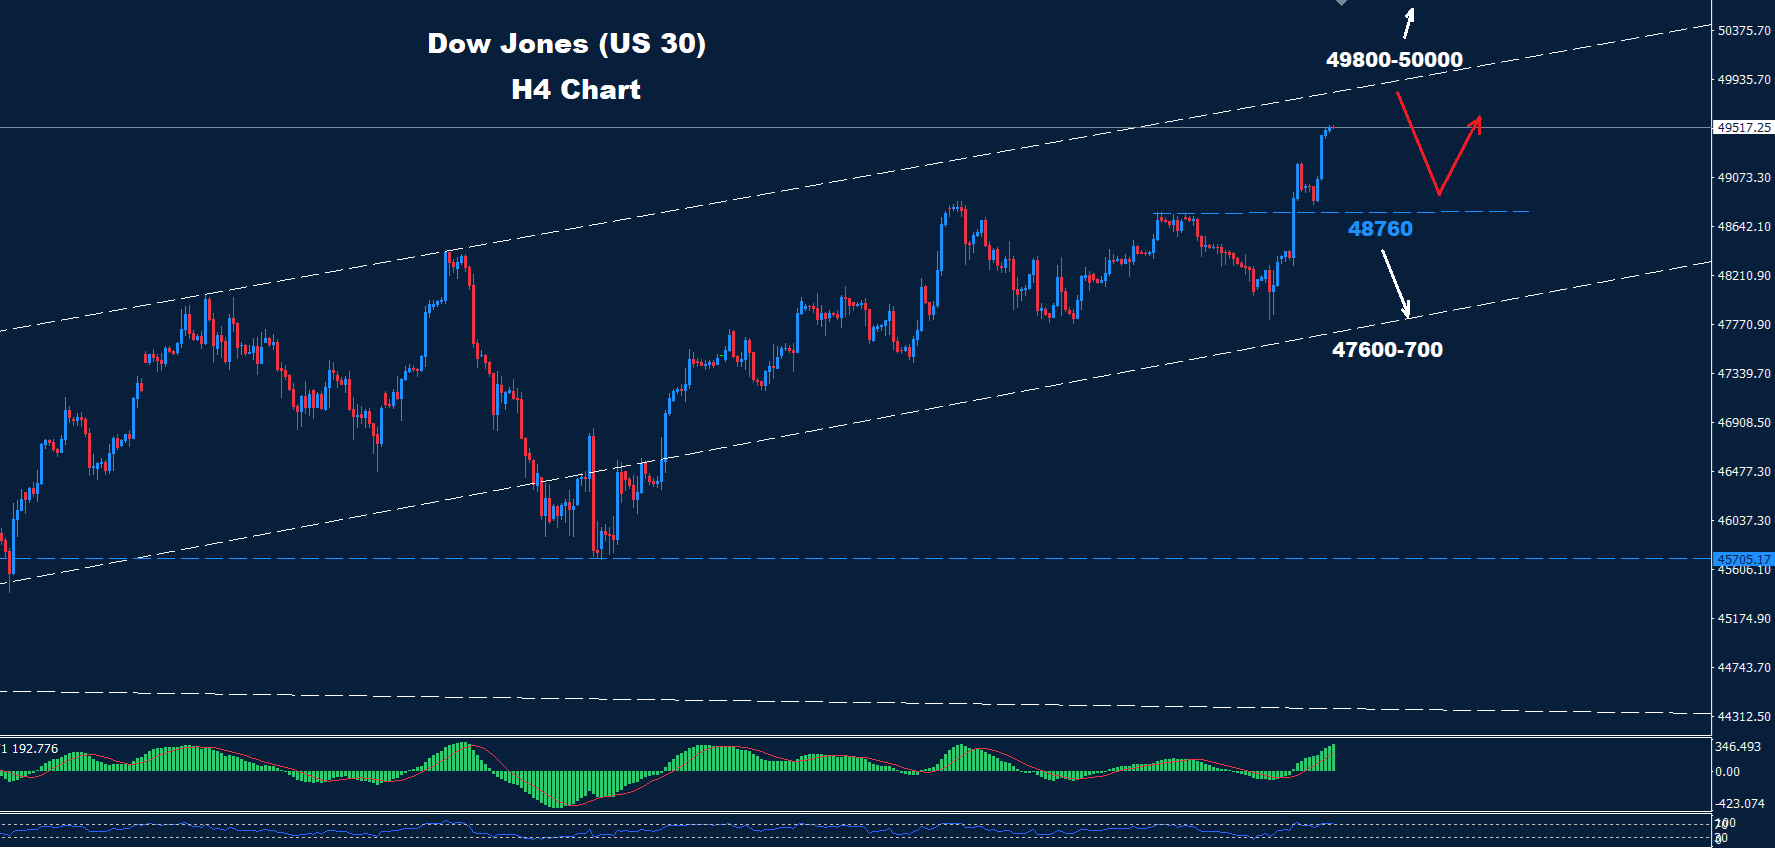
The Dow managed to met the target zone at 49500-600. As we see from the previous chart, prices face an uptrend resistance channel around the 49800-50000 zone which led to a correction towards 48760. As long as the market holds above 48760 the advance wave could...
by Rami Abu-Draa | Jan 15, 2026 | Tecchnical Analysis
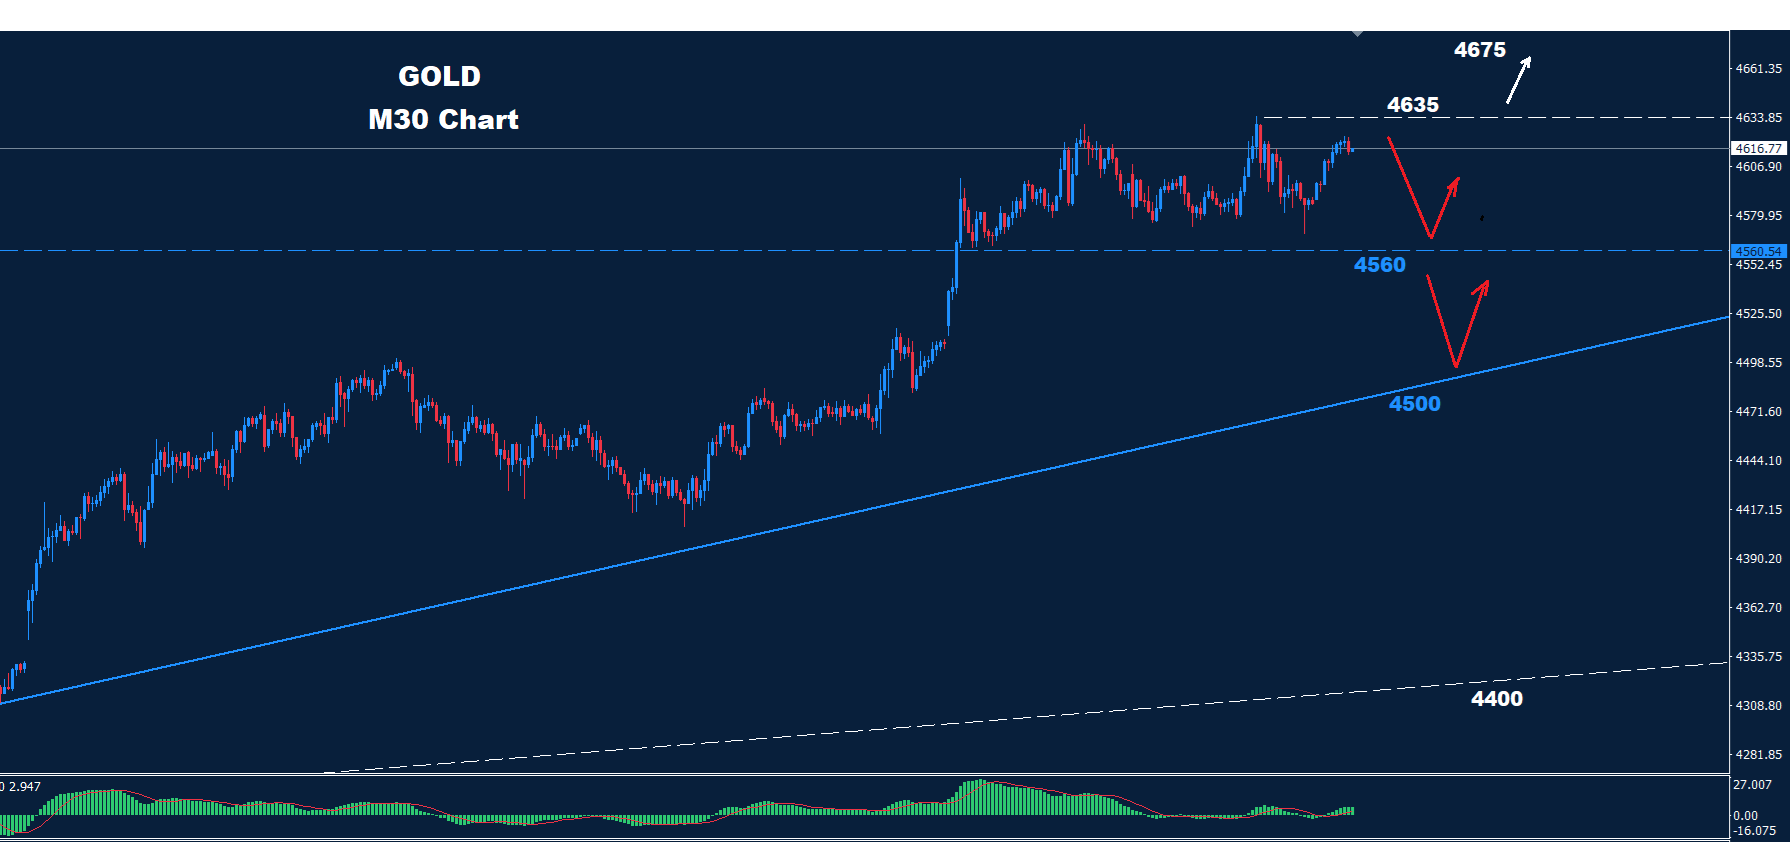
The market managed to test again the resistance of 4635. However, the Intraday chart shows the chance for a trading zone, if prices hold below 4635 with supports at 4560 and 4500. Each support has the chance to push the advance higher. Above 4635-42 the market could...