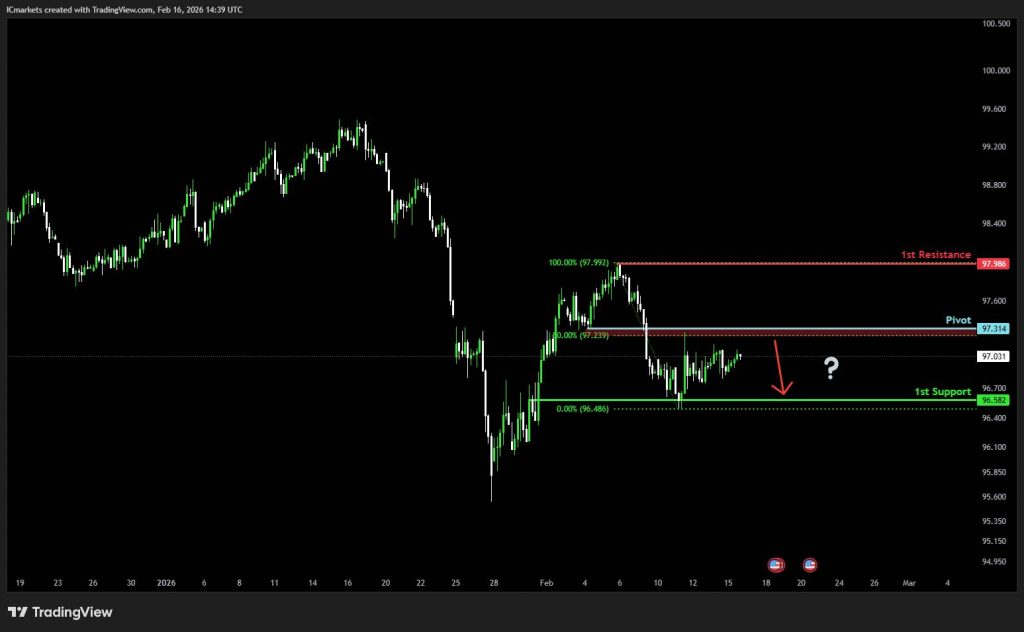
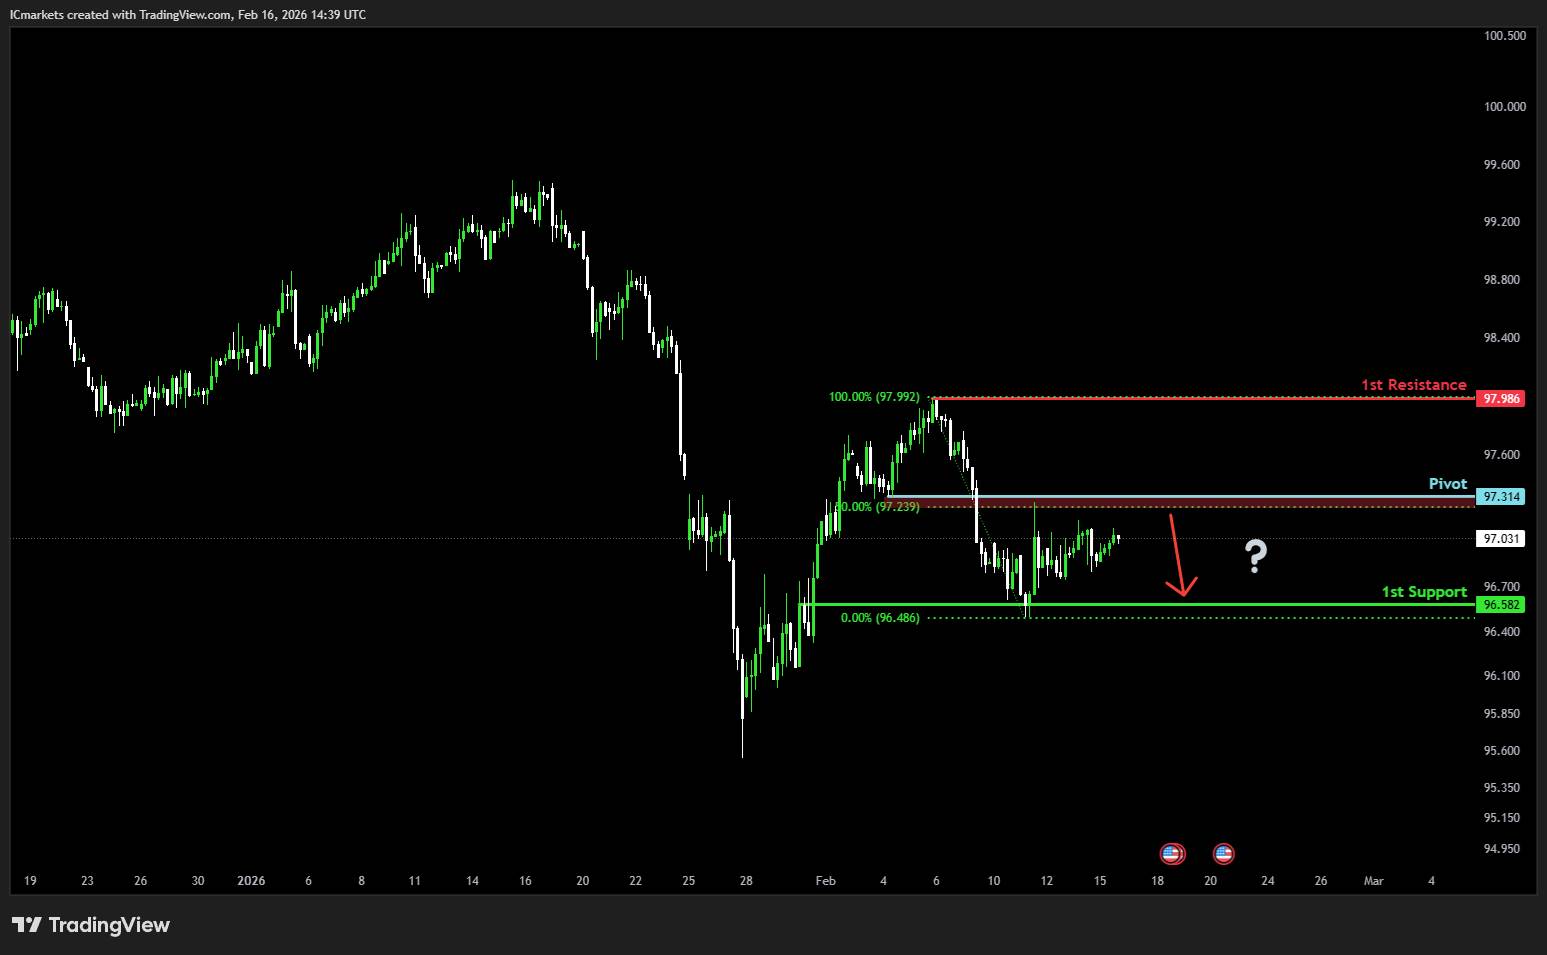
DXY (U.S. Dollar Index):
Potential Direction: Bearish
Overall momentum of the chart: Bearish
The price is rising toward the pivot before continuing its bearish move down toward the 1st support.
Pivot: 97.31
Supporting reasons: Identified as a pullback resistance that is slightly above the 50% Fibonacci retracement, where selling pressure could intensify and potentially cap any upward retracement.
1st support: 96.58
Supporting reasons: Identified as an overlap support, indicating a potential area where the price could again stabilize.
1st resistance: 97.98
Supporting reasons: Identified as a swing high resistance, indicating a potential area that could halt any further upward movement
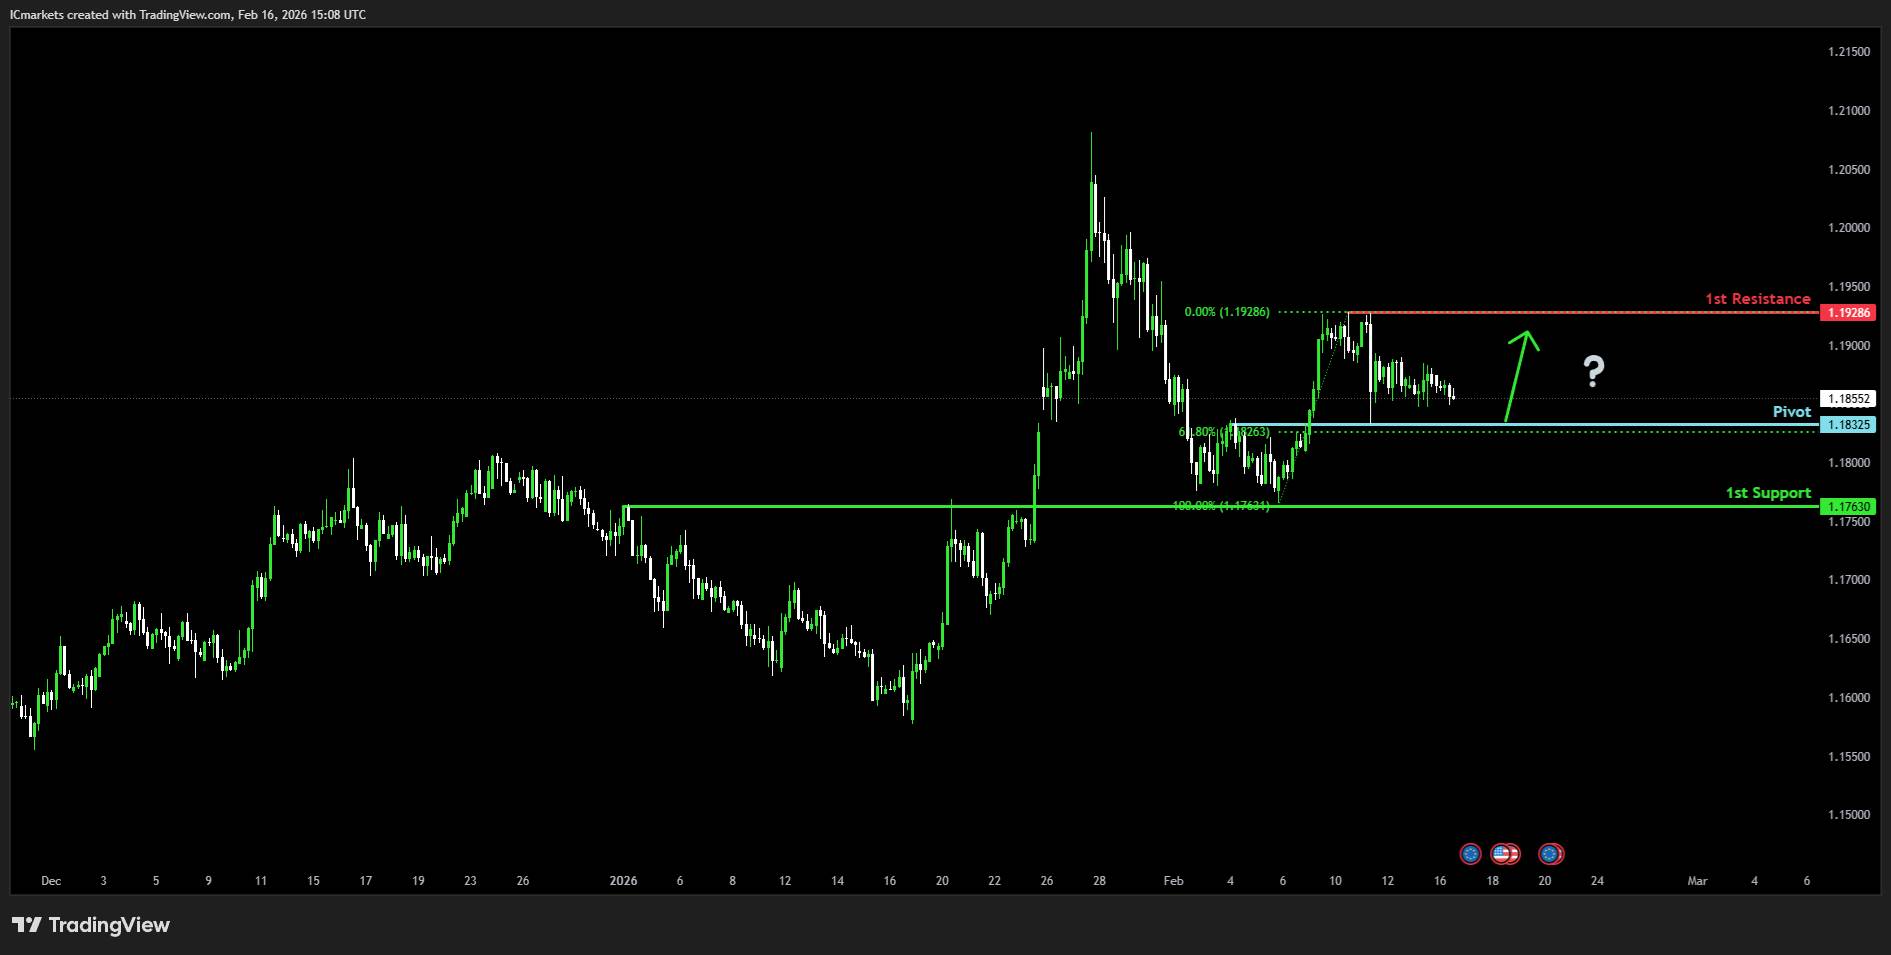
EUR/USD:
Potential Direction: Bullish
Overall momentum of the chart: Bullish
The price is falling toward the pivot before continuing its bullish move up toward the 1st resistance.
Pivot: 1.1920
Supporting reasons: Identified as a pullbacksupport that aligns with the 61.8% Fibonacci retracement, where renewed buying pressure could emerge and push the price to the 1st resistance.
1st support: 1.1763
Supporting reasons: Identified as an overlap support, indicating a potential level where the price could stabilize once again.
1st resistance: 1.1920
Supporting reasons: Identified as a pullback resistance, indicating a potential level that could cap further upward movement.
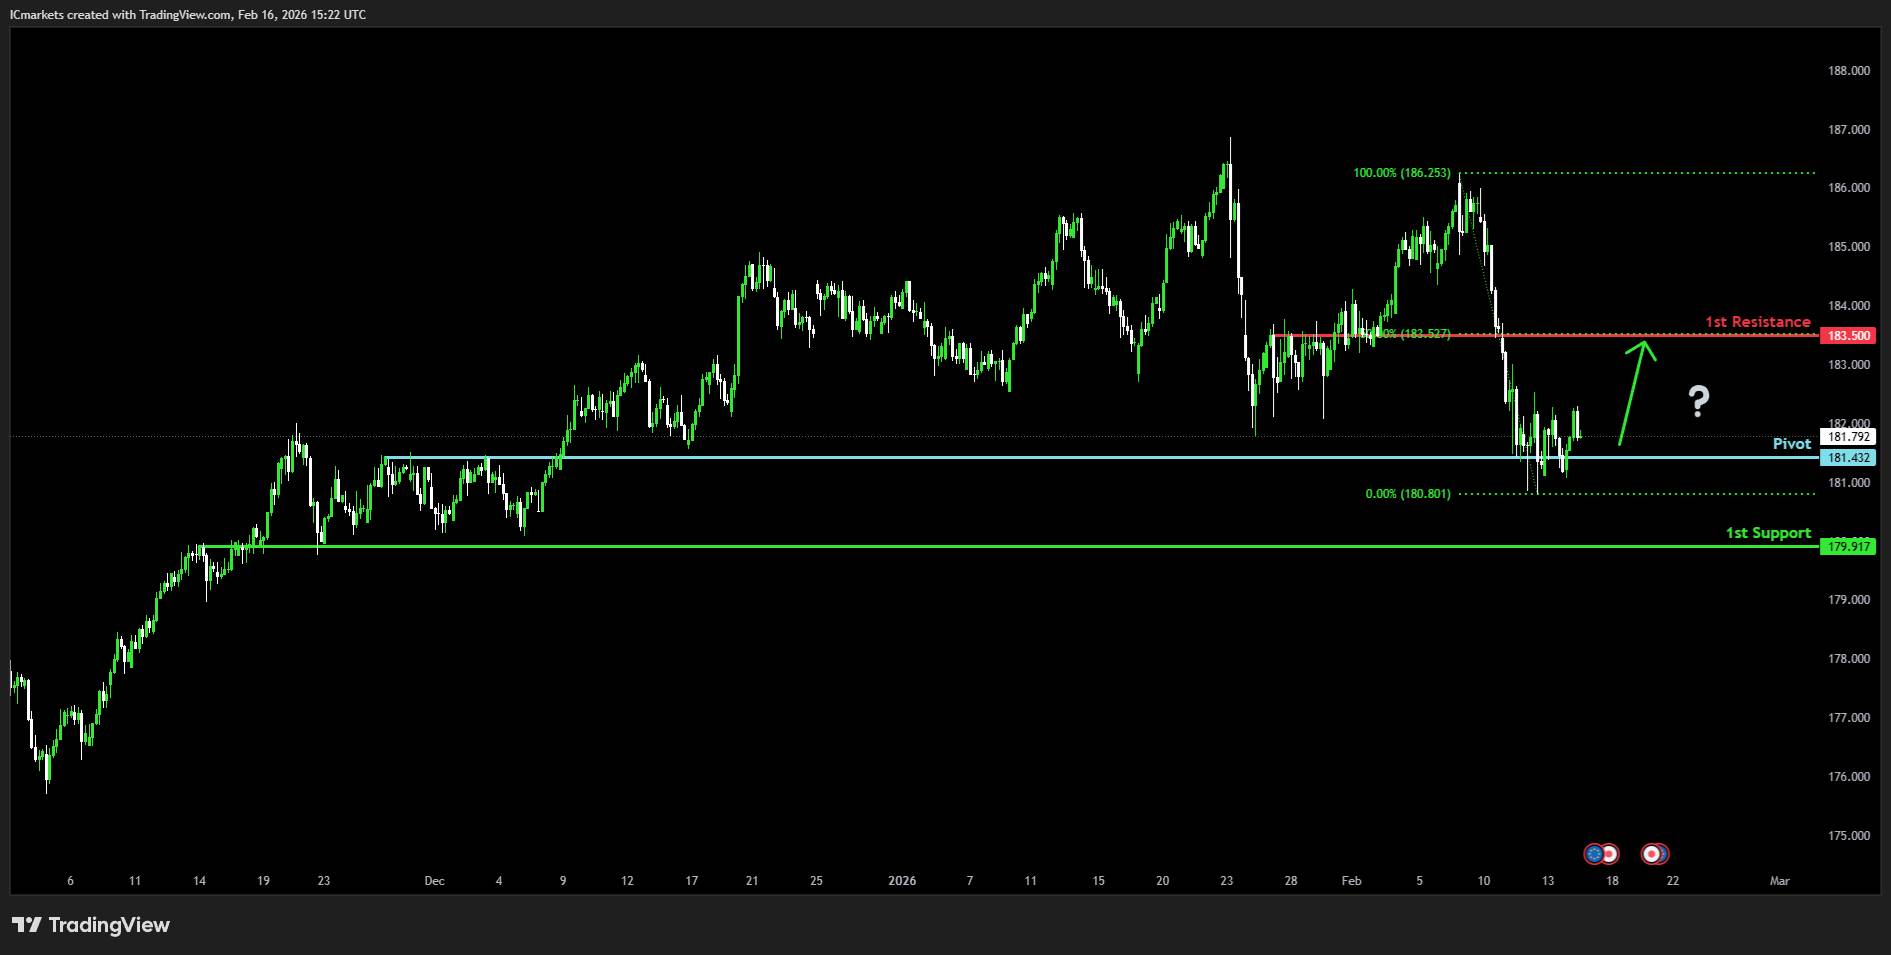
EUR/JPY:
Potential Direction: Bullish
Overall momentum of the chart: Bearish
The price could see a short-term pullback toward the pivot before making a bullish move up toward the 1st resistance.
Pivot: 181.43
Supporting reasons: Identified as a pullback support, where renewed buying pressure could emerge to push the price higher.
1st support: 179.92
Supporting reasons: Identified as an overlap support, indicating a potential area where the price could again stabilize.
1st resistance: 184.08
Supporting reasons: Identified as an overlap resistance that aligns with the 50% Fibonacci retracement, indicating a potential level that could cap further upward movement.
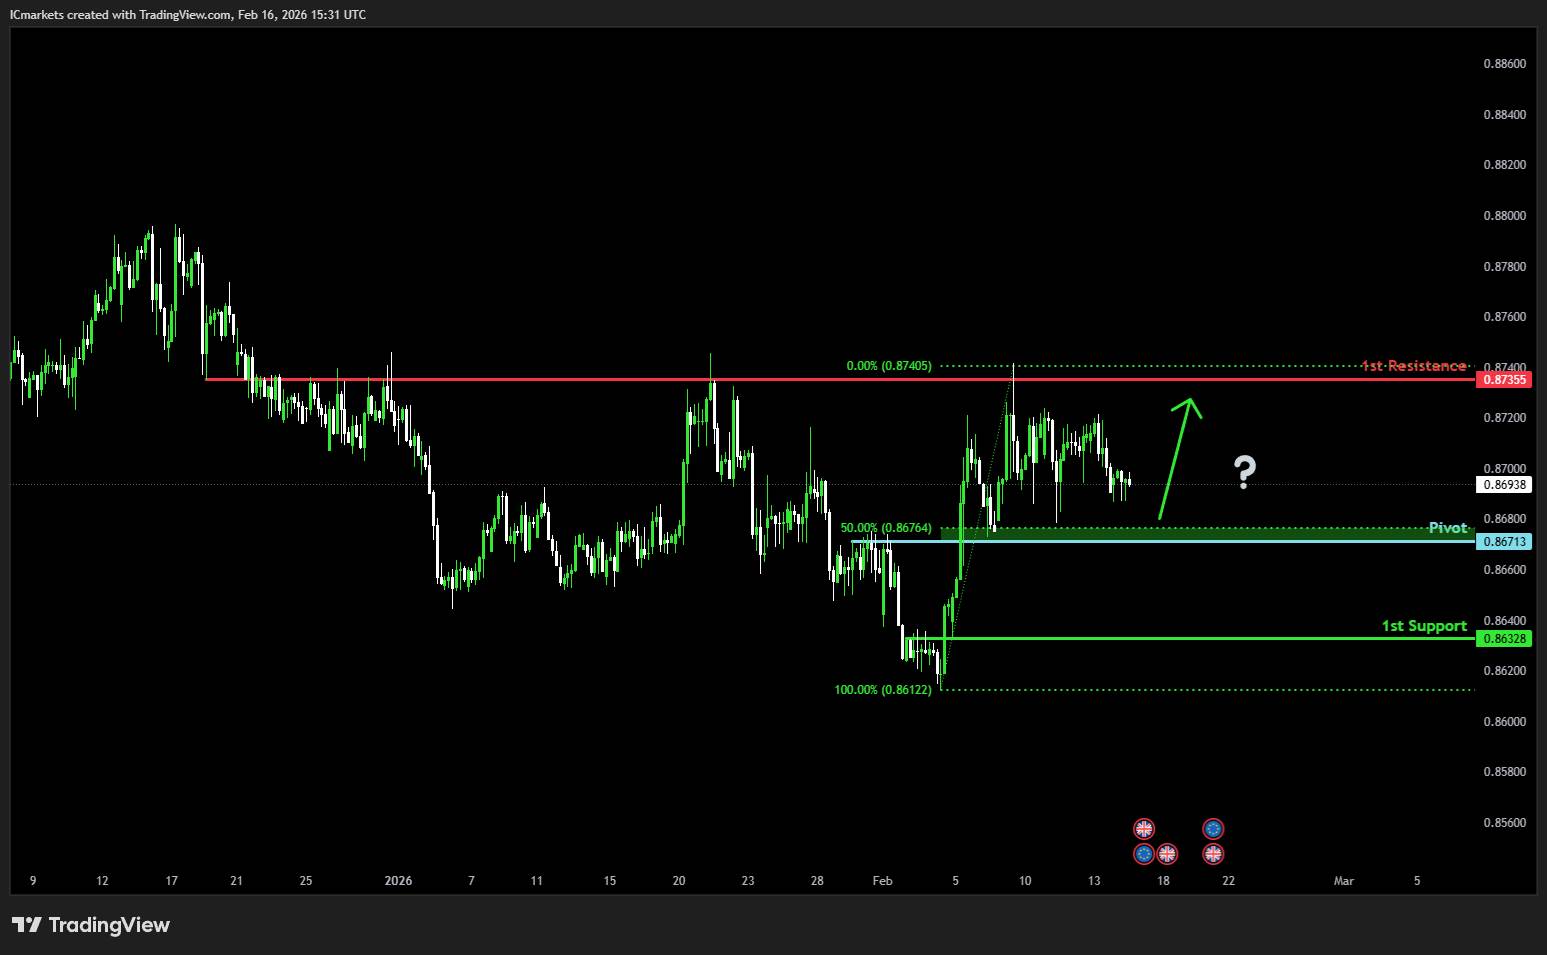
EUR/GBP:
Potential Direction: Bullish
Overall momentum of the chart: Bullish
The price could see a short-term pullback toward the pivot before rising again toward the 1st resistance.
Pivot: 0.8671
Supporting reasons: Identified as a pullback support that aligns with the 50% Fibonacci retracement, where renewed buying pressure could emerge to push the price higher.
1st support: 0.8632
Supporting reasons: Identified as a pullback support, indicating a potential area where the price could stabilize once more.
1st resistance: 0.8735
Supporting reasons: Identified as an overlap resistance, indicating a potential level that could cap further upward movement.
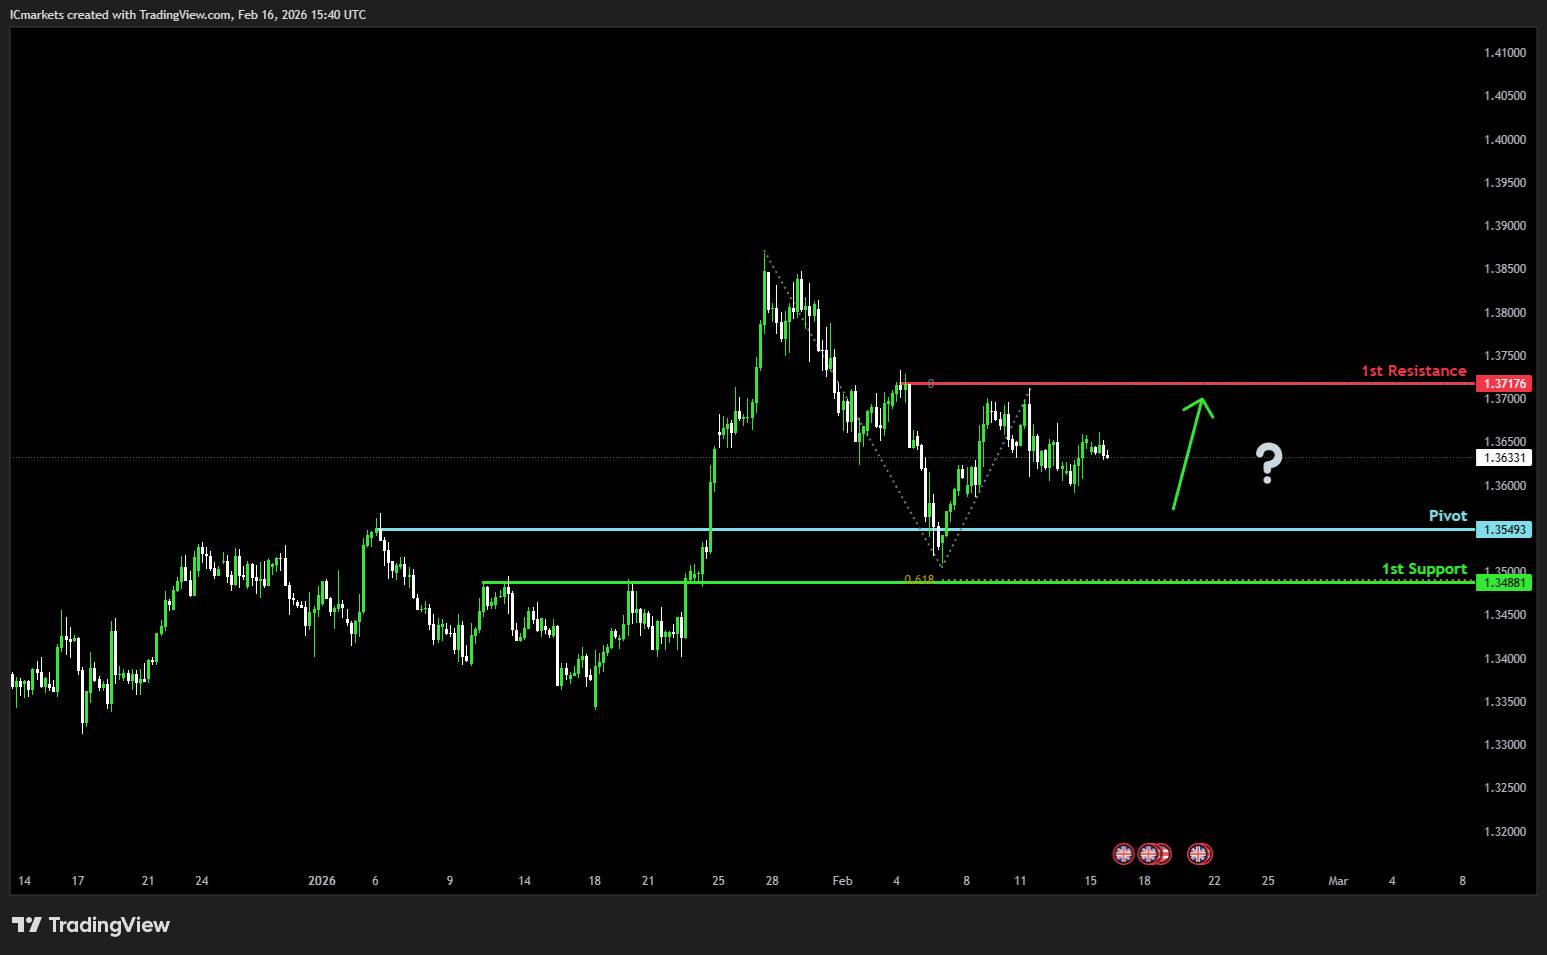
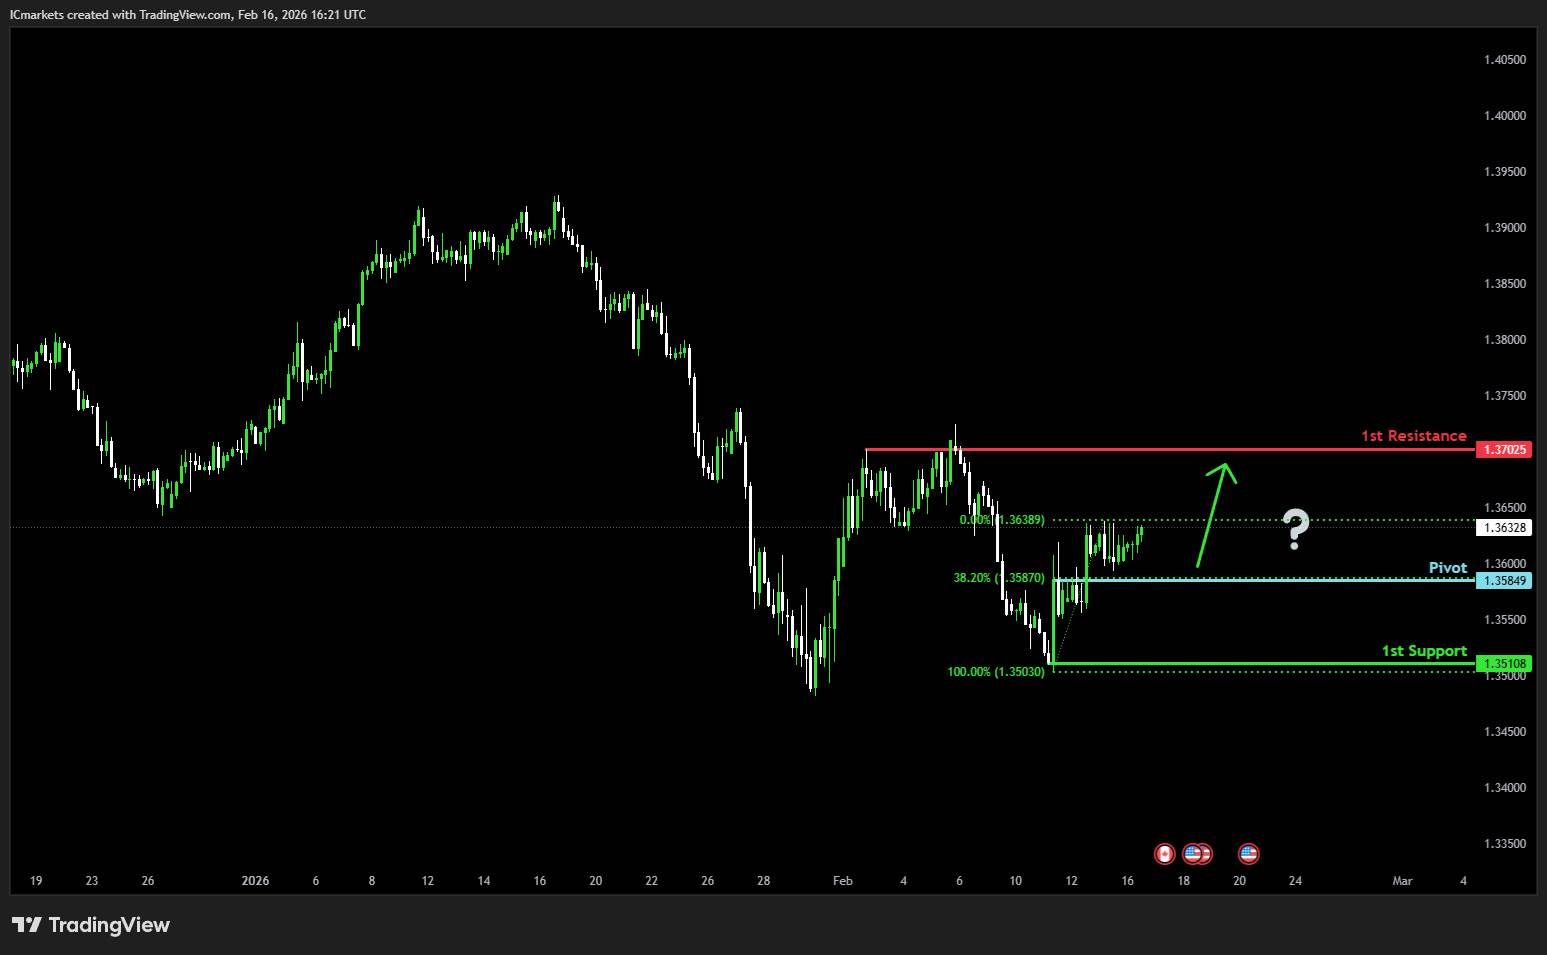
GBP/USD:
Potential Direction: Bullish
Overall momentum of the chart: Bullish
The price could fall toward the pivot before continuing its bullish move toward the 1st resistance.
Pivot: 1.3549
Supporting reasons: Identified as an overlap support, where buying pressures could emerge and push the price higher.
1st support: 1.3488
Supporting reasons: Identified as a pullback support that aligns with the 61.8% Fibonacci projection, indicating a potential area where the price could stabilize once more.
1st resistance: 1.3765
Supporting reasons: Identified as a pullback resistance, indicating a potential level that could halt further upward movement.
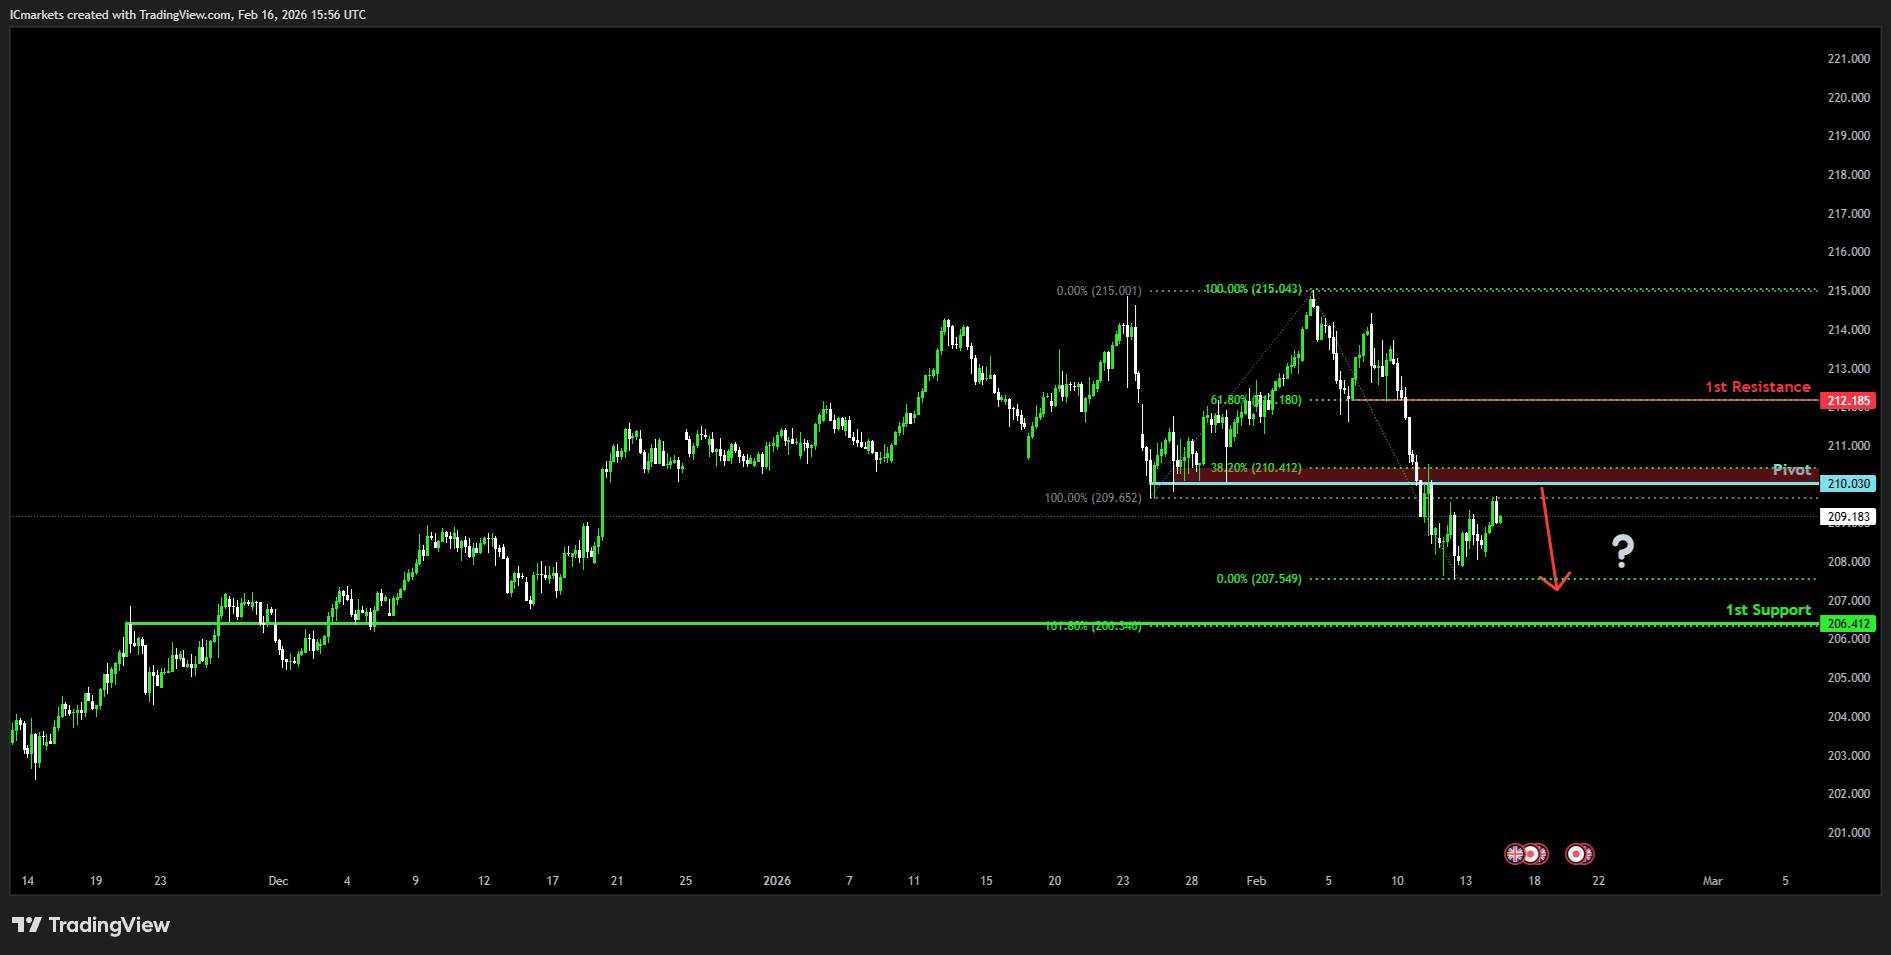
GBP/JPY:
Potential Direction: Bearish
Overall momentum of the chart: Bullish
The price could make a short-term pullback toward the pivot before continuing its bearish move toward the 1st support.
Pivot: 210.03
Supporting reasons: Identified as a pullback resistance, which is slightly below the 38.2% Fibonacci retracement, where selling pressure could intensify and potentially cap any upward retracement.
1st support: 206.41
Supporting reasons: Identified as a pullback support that aligns with the 161.8% Fibonacci extension, indicating a potential level where the price could stabilize once more.
1st resistance: 217.18
Supporting reasons: Identified as a pullback resistance that aligns with the 61.8% Fibonacci retracement, indicating a potential level that could halt further upward movement.
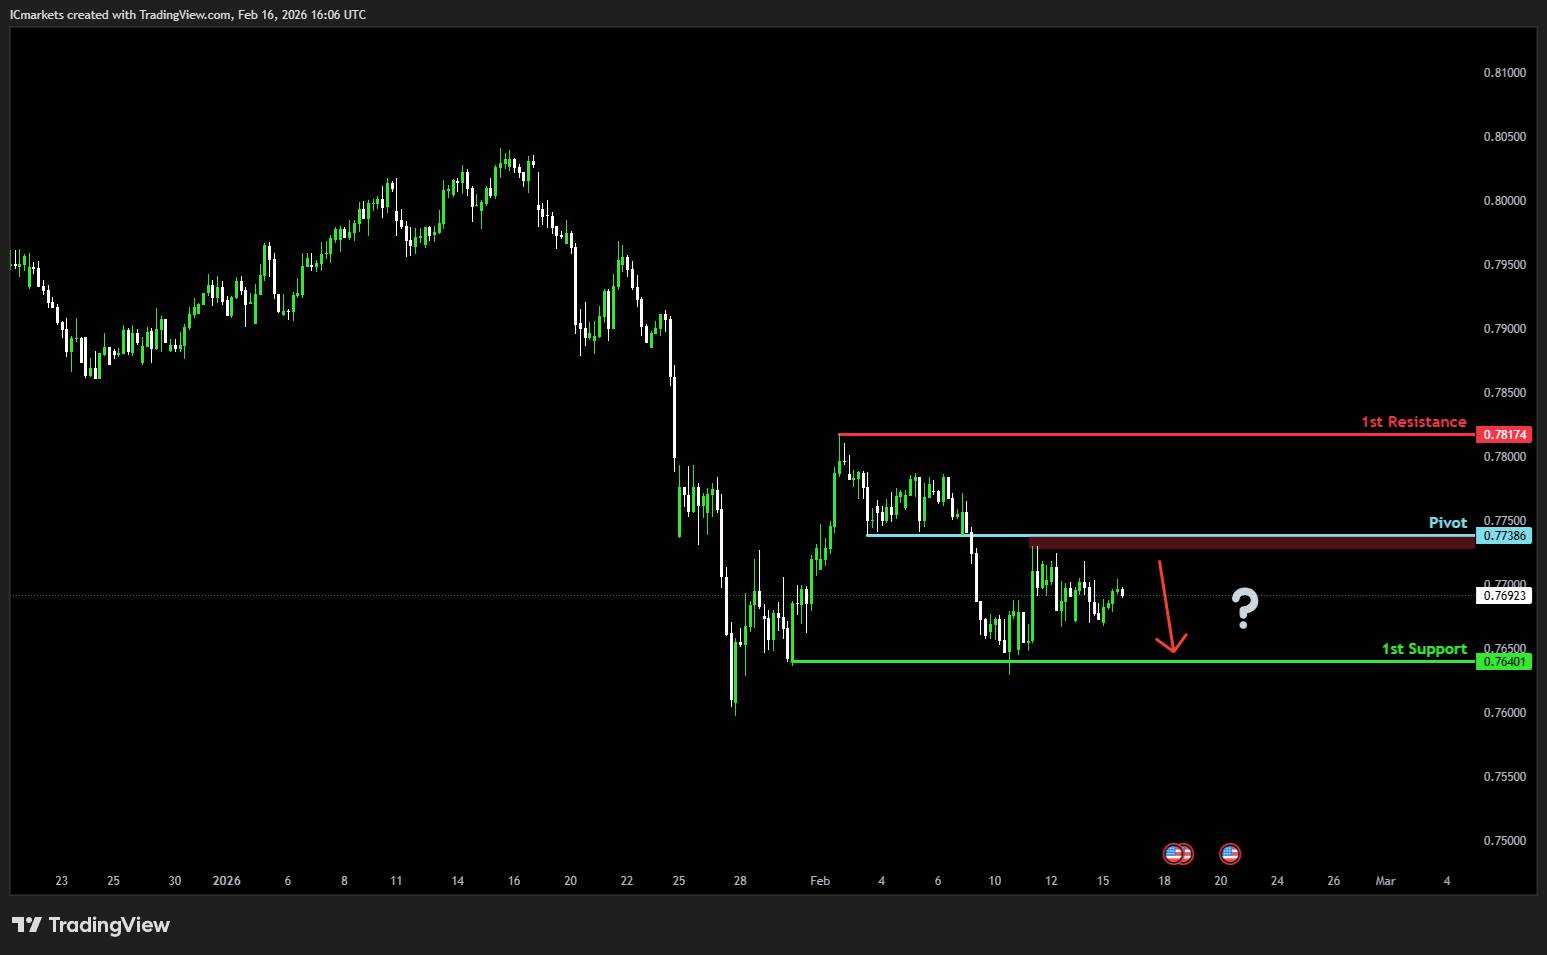
USD/CHF:
Potential Direction: Bearish
Overall momentum of the chart: Bearish
The price could make a short-term pullback toward the pivot before falling again to the 1st support.
Pivot: 0.7738
Supporting reasons: Identified as a pullback resistance, where selling pressures could intensify and potentially cap any upward retracement.
1st support: 0.7640
Supporting reasons: Identified as a pullback support, indicating a potential level where the price could again stabilize.
1st resistance: 0.7817
Supporting reasons: Identified as a swing high resistance, indicating a potential level that could cap further upward movement.
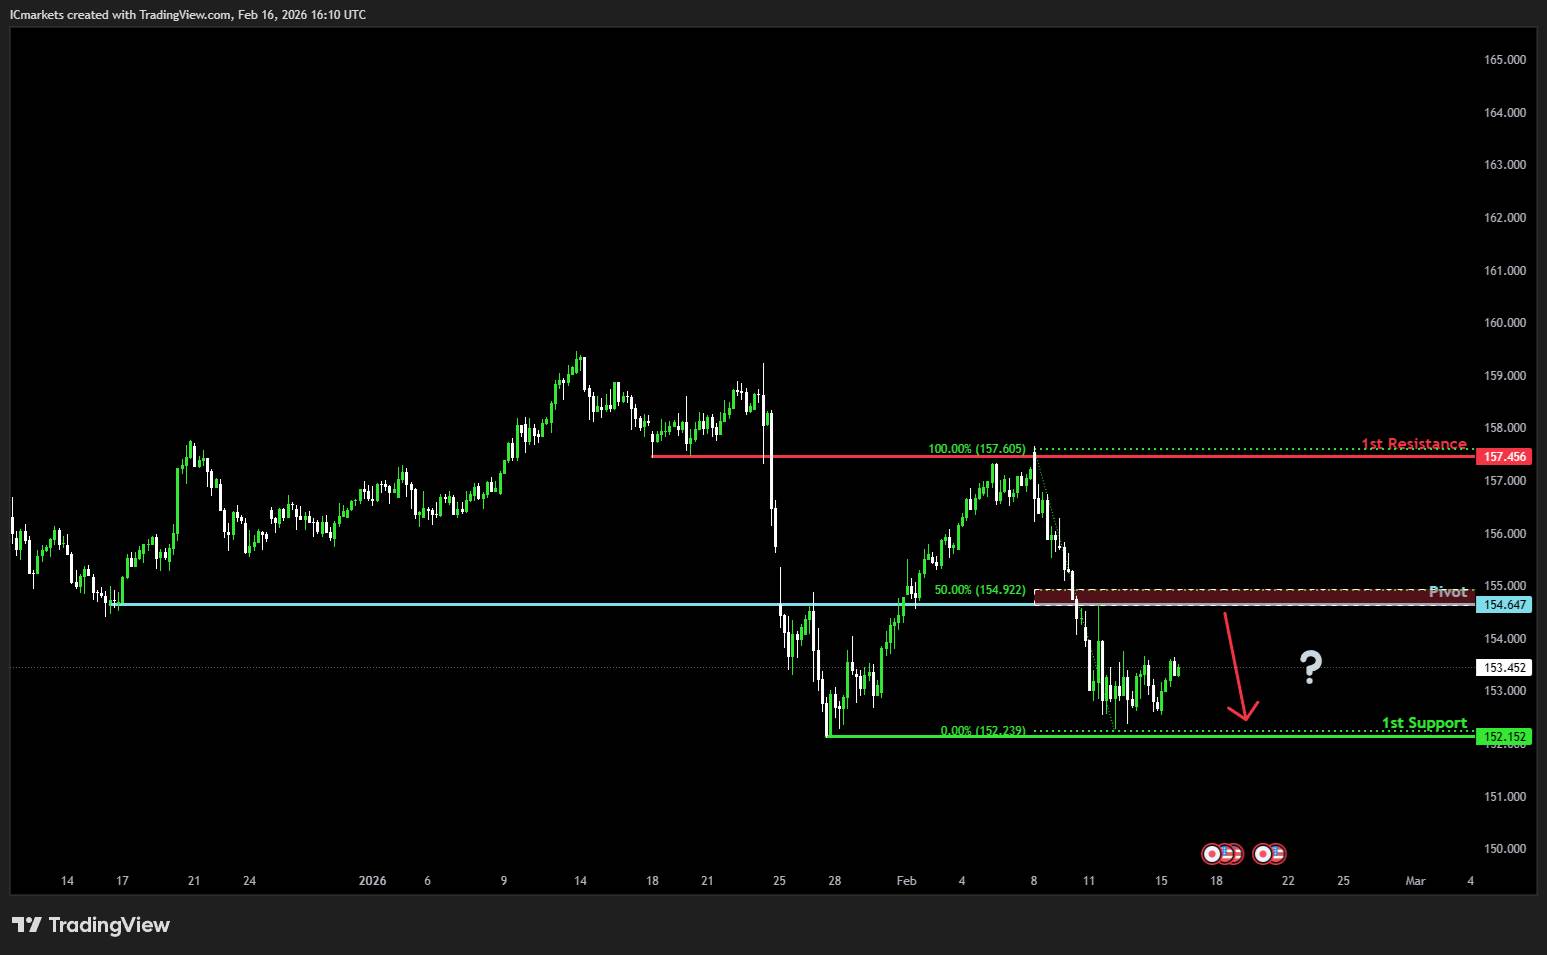
USD/JPY:
Potential Direction: Bearish
Overall momentum of the chart: Bearish
The price is rising toward the pivot before continuing its bearish move down toward the 1st support.
Pivot: 154.64
Supporting reasons: Identified as a pullback resistance that is slightly below the 50% Fibonacci retracement, where selling pressures could intensify and potentially cap any upward retracement.
1st support: 152.15
Supporting reasons: Identified as a swing low support, indicating a strong area where buyers might return, and the price could stabilize once again.
1st resistance: 157.45
Supporting reasons: Identified as an overlap resistance. This level represents the next key area where upward movement could be capped amid increased selling pressure
USD/CAD:
Potential Direction: Bullish
Overall momentum of the chart: Bearish
The price could see a short-term pullback toward the pivot before rising toward the 1st resistance.
Pivot: 1.3584
Supporting reasons: Identified as a pullback support that aligns with the 38.2% Fibonacci retracement, where buying pressure could emerge and push the price higher.
1st support: 1.3510
Supporting reasons: Identified as a swing low support, indicating a key level where the price could stabilize once more.
1st resistance: 1.3702
Supporting reasons: Identified as a swing high resistance, making it a possible target for bullish advances and a level where some sellers could return to cap gains
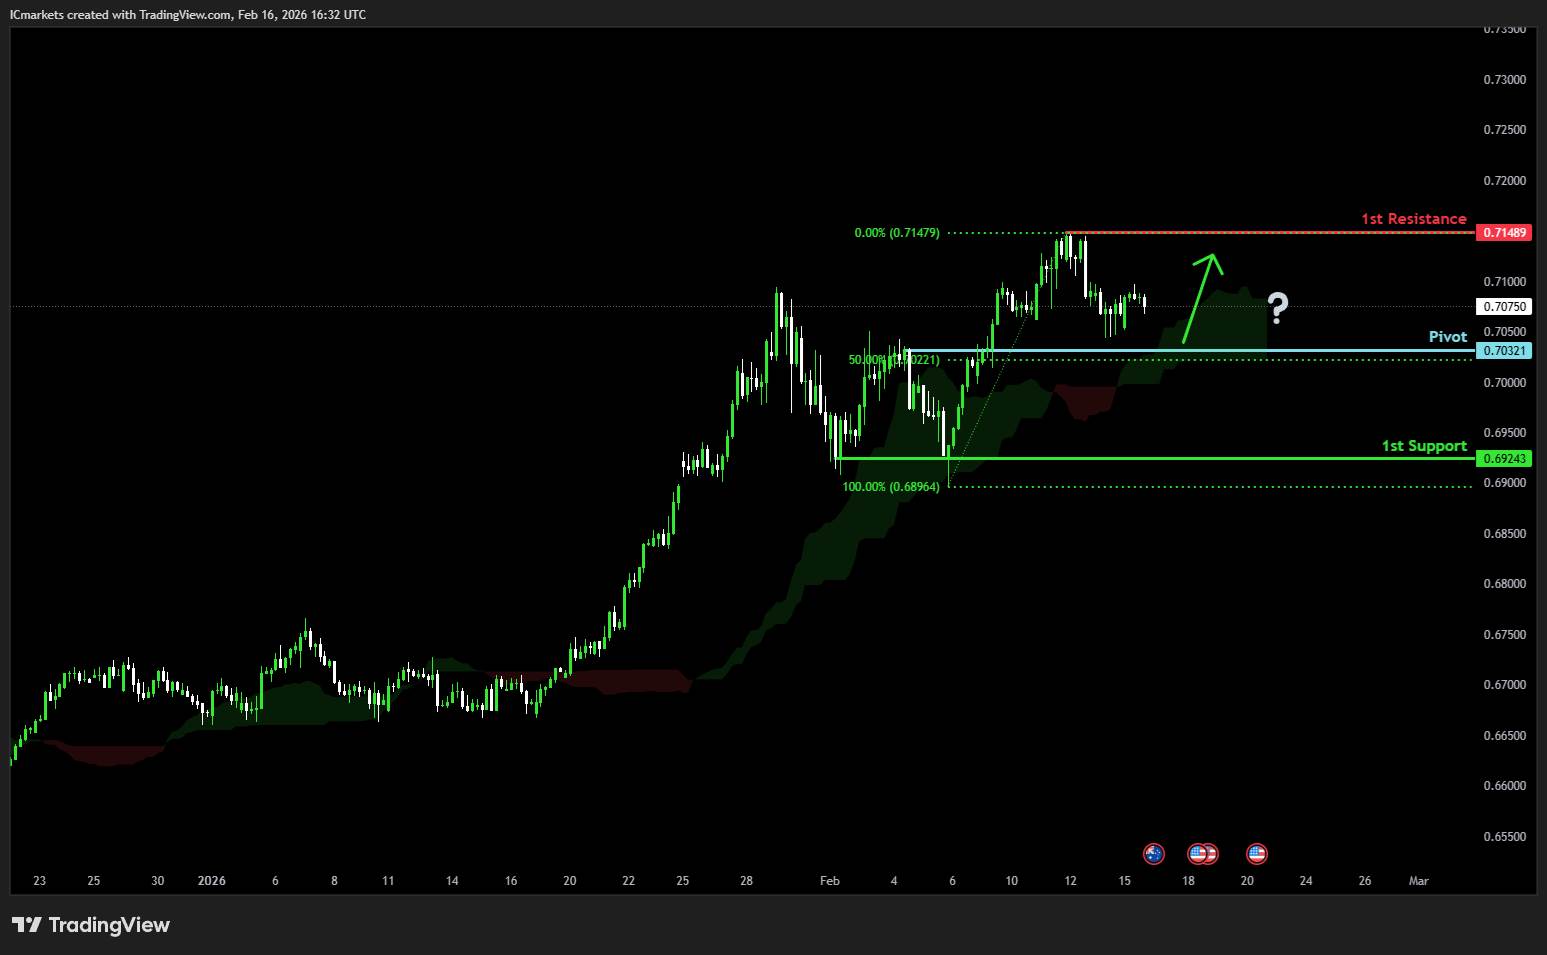
AUD/USD:
Potential Direction: Bullish
Overall momentum of the chart: Bullish
The price could make a short-term pullback to the pivot and may continue its bullish move toward the 1st resistance
Pivot: 0.7032
Supporting reasons: Identified as a pullback support that aligns with the 50% Fibonacci retracement, where renewed buying pressure could emerge to push the price higher.
1st support: 0.6924
Supporting reasons: Identified as a multi-swing low support, indicating a potential area where the price could stabilize.
1st resistance: 0.7148
Supporting reasons: Identified as a swing high resistance, indicating a potential area that could halt any further upward movement.
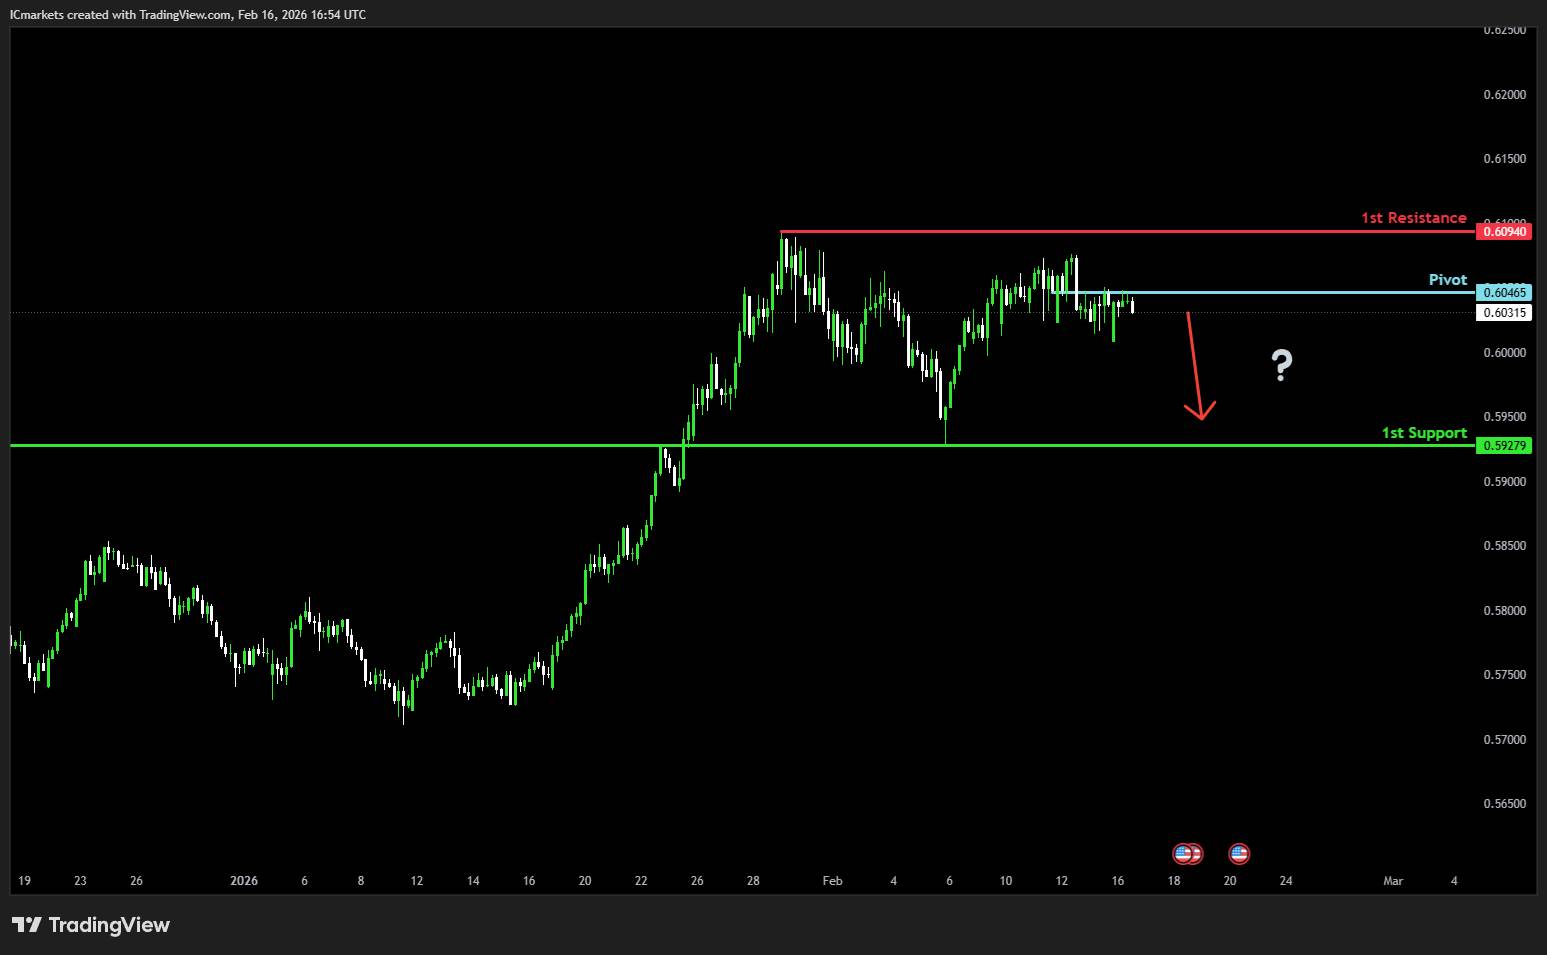
NZD/USD
Potential Direction: Bearish
Overall momentum of the chart: Bullish
The price is reacting off the pivot and may fall toward the 1st support.
Pivot: 0.6046
Supporting reasons: Identified as a pullback resistance, where we could see a bearish move to the downside.
1st support: 0.5927
Supporting reasons: Identified as a pullback support, this area has provided strong support historically and may attract buying interest for a potential short-term bounce
1st resistance: 0.6087
Supporting reasons: Identified as a swing high resistance, indicating a potential area that could halt any further upward movement.
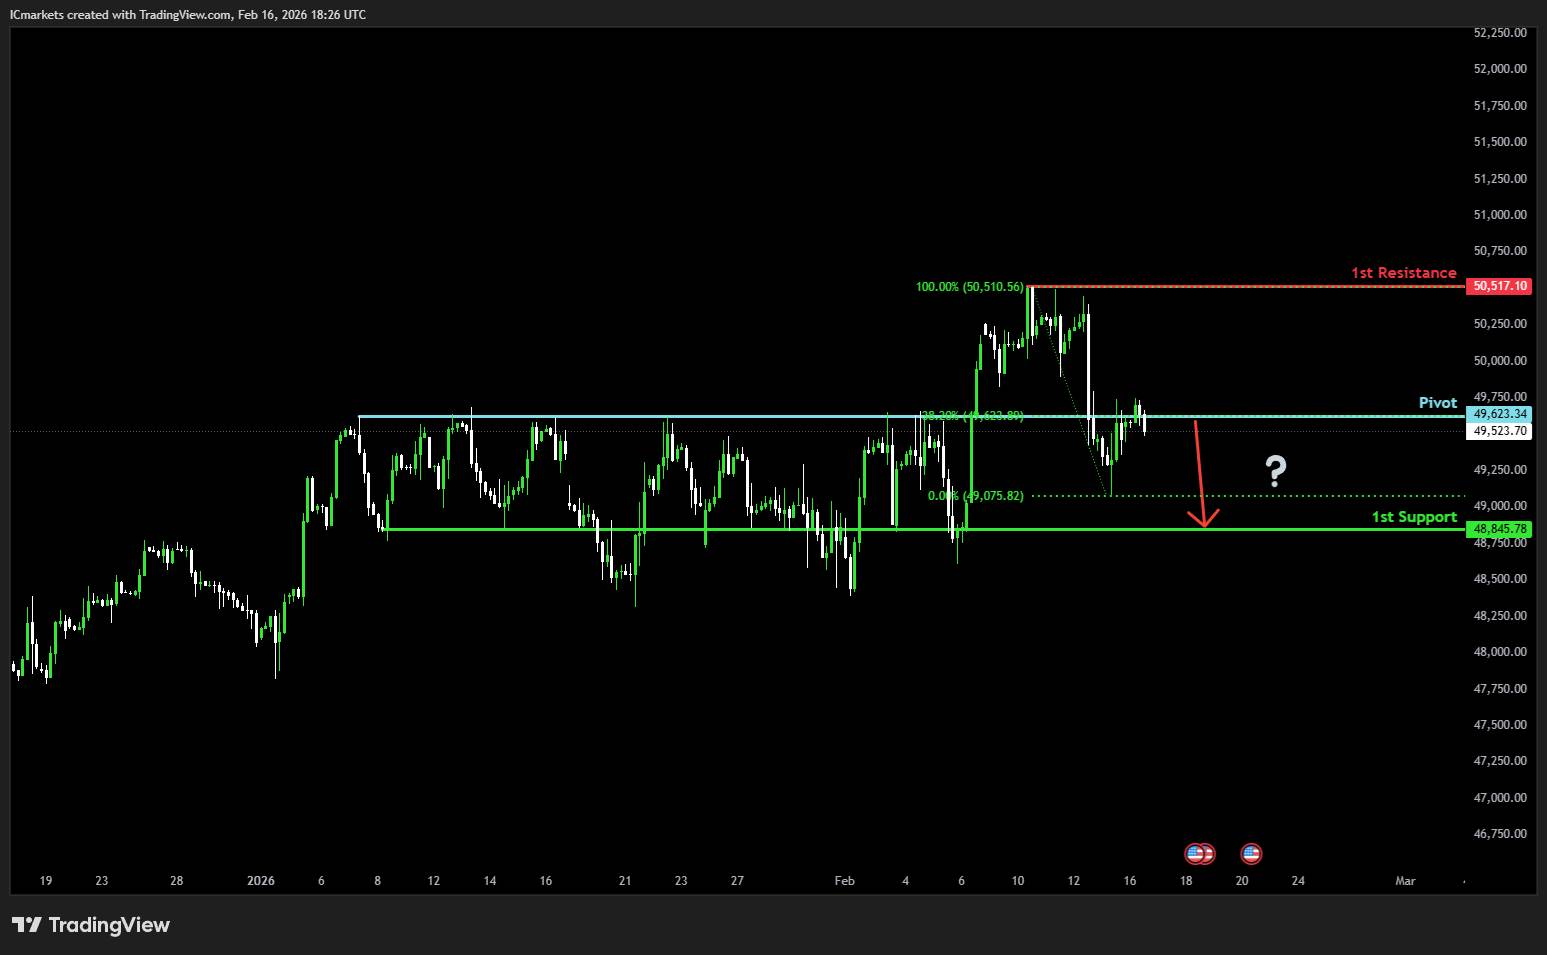
US30 (DJIA):
Potential Direction: Bearish
Overall momentum of the chart: Bullish
The price is currently reacting off the pivot before continuing its bearish move down toward the 1st support.
Pivot: 49,623.34
Supporting reasons: Identified as an overlap resistance that aligns with he 38.2% Fibonacci retracement, where selling pressures could intensify and potentially cap any upward retracement
1st support: 48,845.78
Supporting reasons: Identified as an overlap support, suggesting a potential area where the price could stabilize once again.
1st resistance: 50,517.10
Supporting reasons: Identified as a swing high resistance, indicating a potential area that could halt any further upward movement.
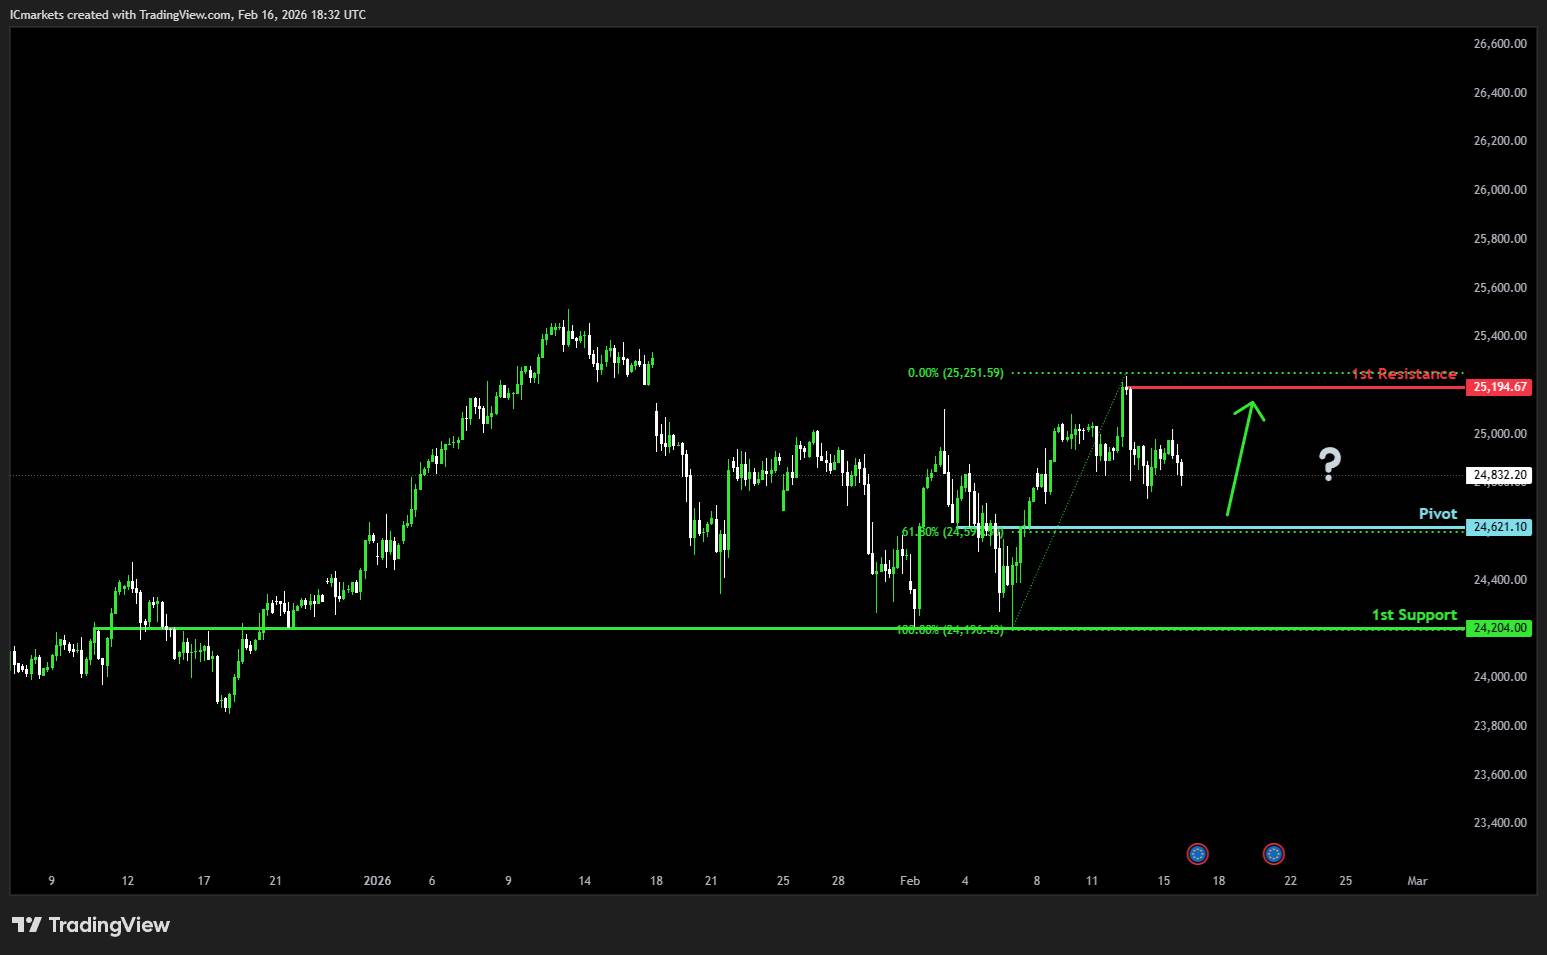
DE40 (DAX):
Potential Direction: Bullish
Overall momentum of the chart: Bullish
The price could see a short-term pullback toward the pivot before rising again toward the 1st resistance.
Pivot: 24,621.10
Supporting reasons: Identified as a pullback support, where renewed buying pressure could emerge to push the price higher.
1st support: 24,204.00
Supporting reasons: Identified as an overlap support, indicating a key level where the price could stabilize once more.
1st resistance: 25,194.67
Supporting reasons: Identified as a pullback resistance, indicating a potential area that could halt any further upward movement.
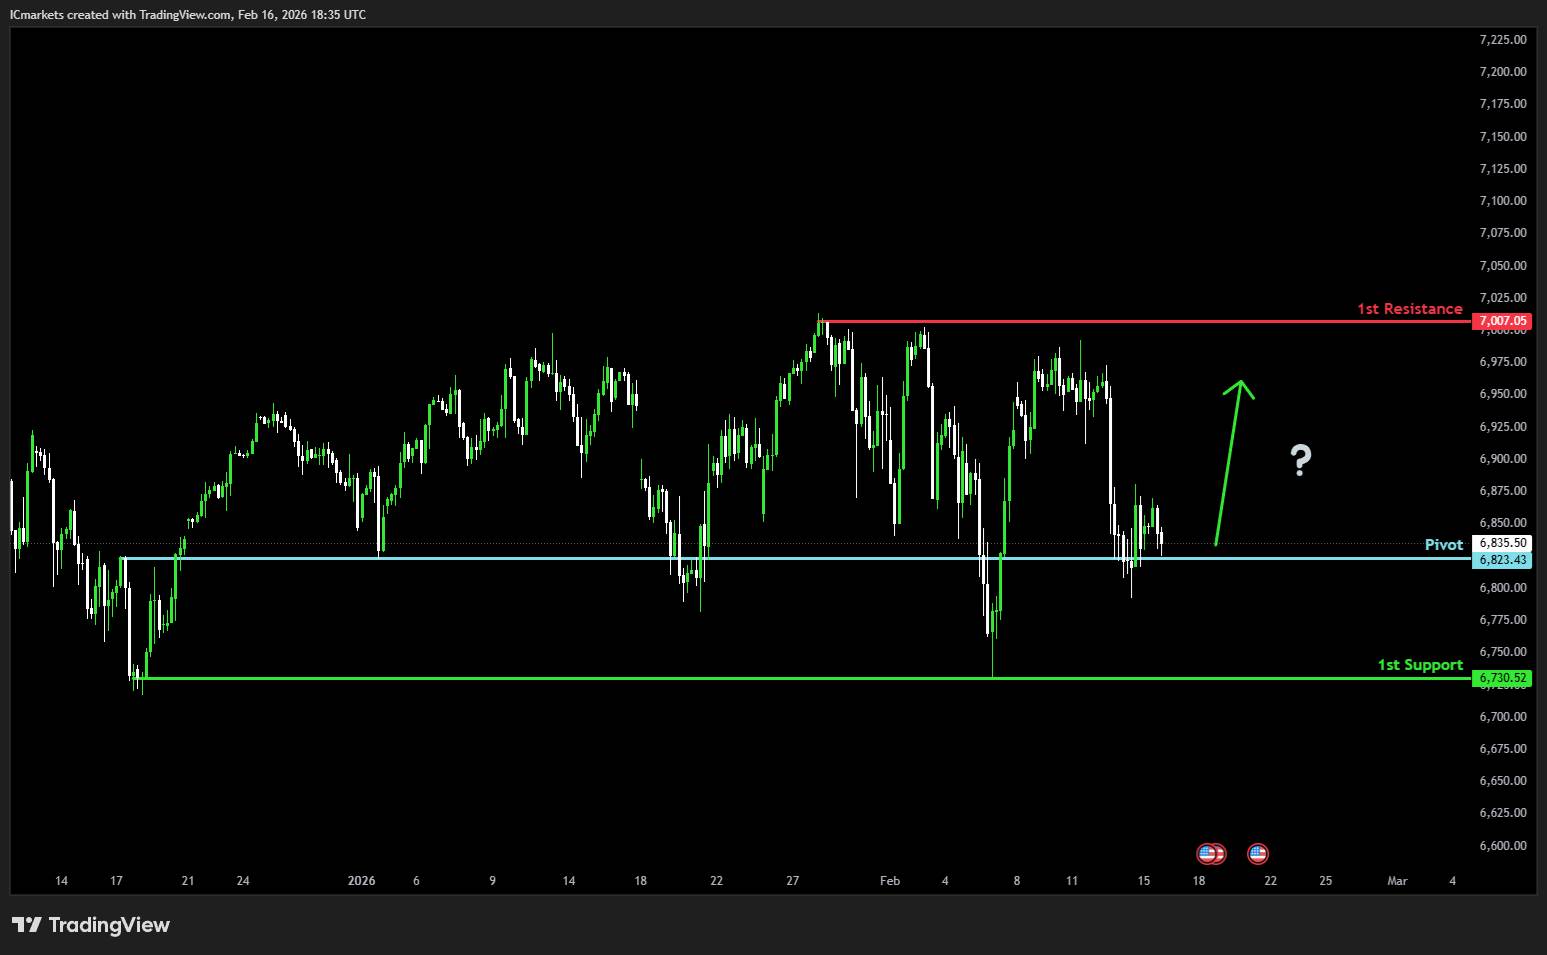
US500 (S&P 500):
Potential Direction: Bullish
Overall momentum of the chart: Bullish
The price could see a short-term pullback toward the pivot before rising again toward the 1st resistance.
Pivot: 6,823.43
Supporting reasons: Identified as a pullback support, where renewed buying pressure could emerge to push the price higher.
1st support: 6,730.52
Supporting reasons: Identified as a swing low support, indicating a potential level where the price could stabilize once again.
1st resistance: 7,007.05
Supporting reasons: Identified as a swing high resistance, indicating a potential area that could halt any further upward movement.
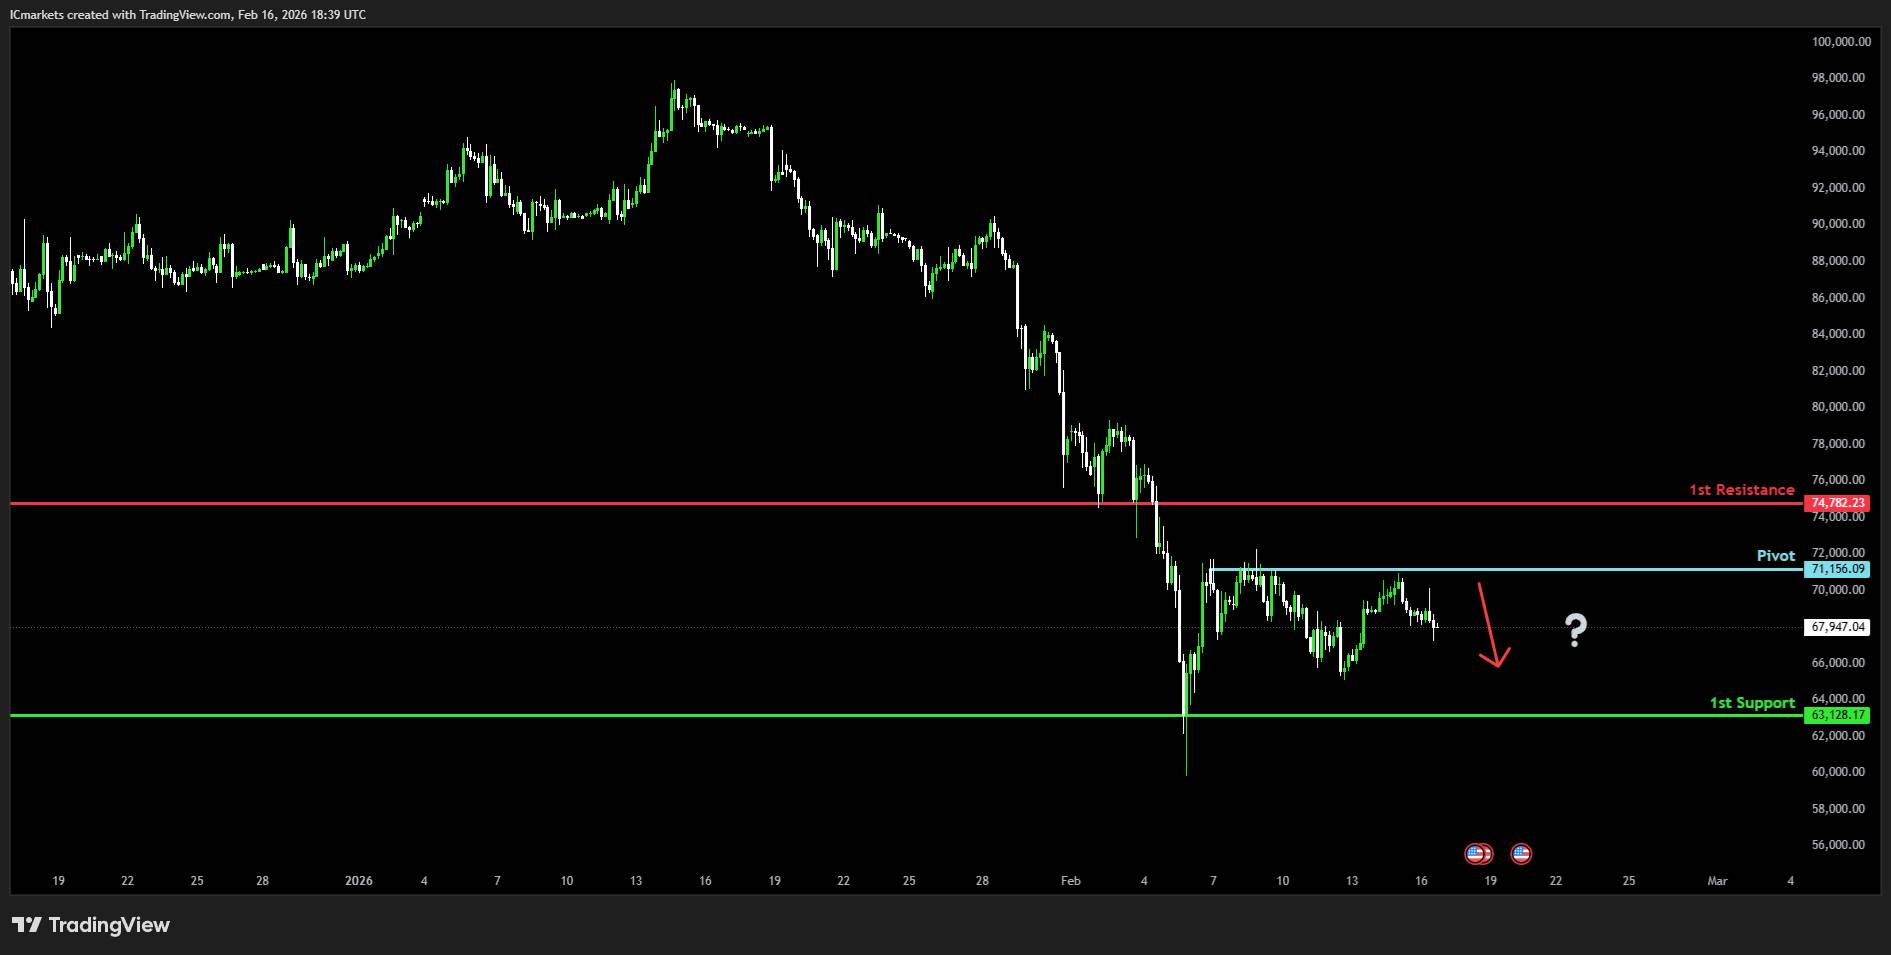
BTC/USD (Bitcoin):
Potential Direction: Bearish
Overall momentum of the chart: Bearish
The price could make a short-term pullback toward the pivot and may continue its bearish move toward the 1st support.
Pivot: 68,606.58
Supporting reasons: Identified as an overlap resistance, where selling pressures could intensify and potentially cap any upward retracement.
1st support:71,156.09
Supporting reasons: Identified as a pullback support, indicating a potential level where the price could stabilize once more.
1st resistance: 74,782.23
Supporting reasons: Identified as a pullback resistance, indicating a potential area that could halt any further upward movement.
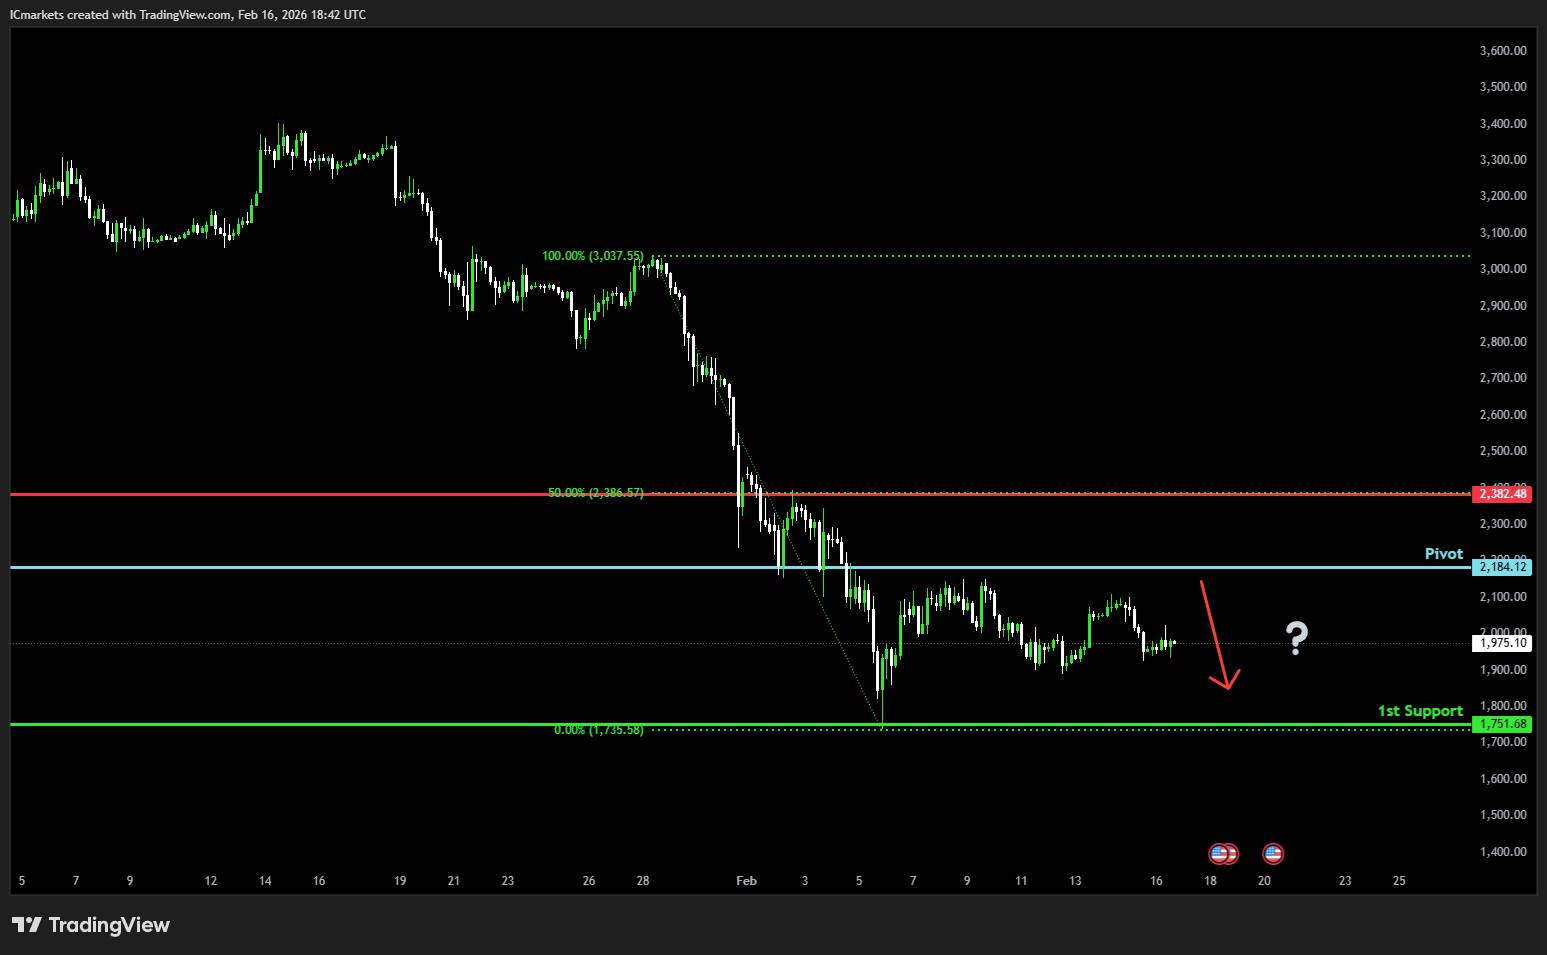
ETH/USD (Ethereum):
Potential Direction: Bearish
Overall momentum of the chart: Bearish
The price could make a short-term pullback to the pivot and may continue its bearish move toward the 1st support.
Pivot: 2,184.12
Supporting reasons: Identified as a pullback resistance, where selling pressures could intensify and potentially cap any upward retracement.
1st support: 1,751.68
Supporting reasons: Identified as a swing low support, indicating a potential level where the price could stabilize once more.
1st resistance: 2,382.48
Supporting reasons: Identified as a pullback resistance that aligns with the 50% Fibonacci retracement, indicating a potential area that could halt any further upward movement.
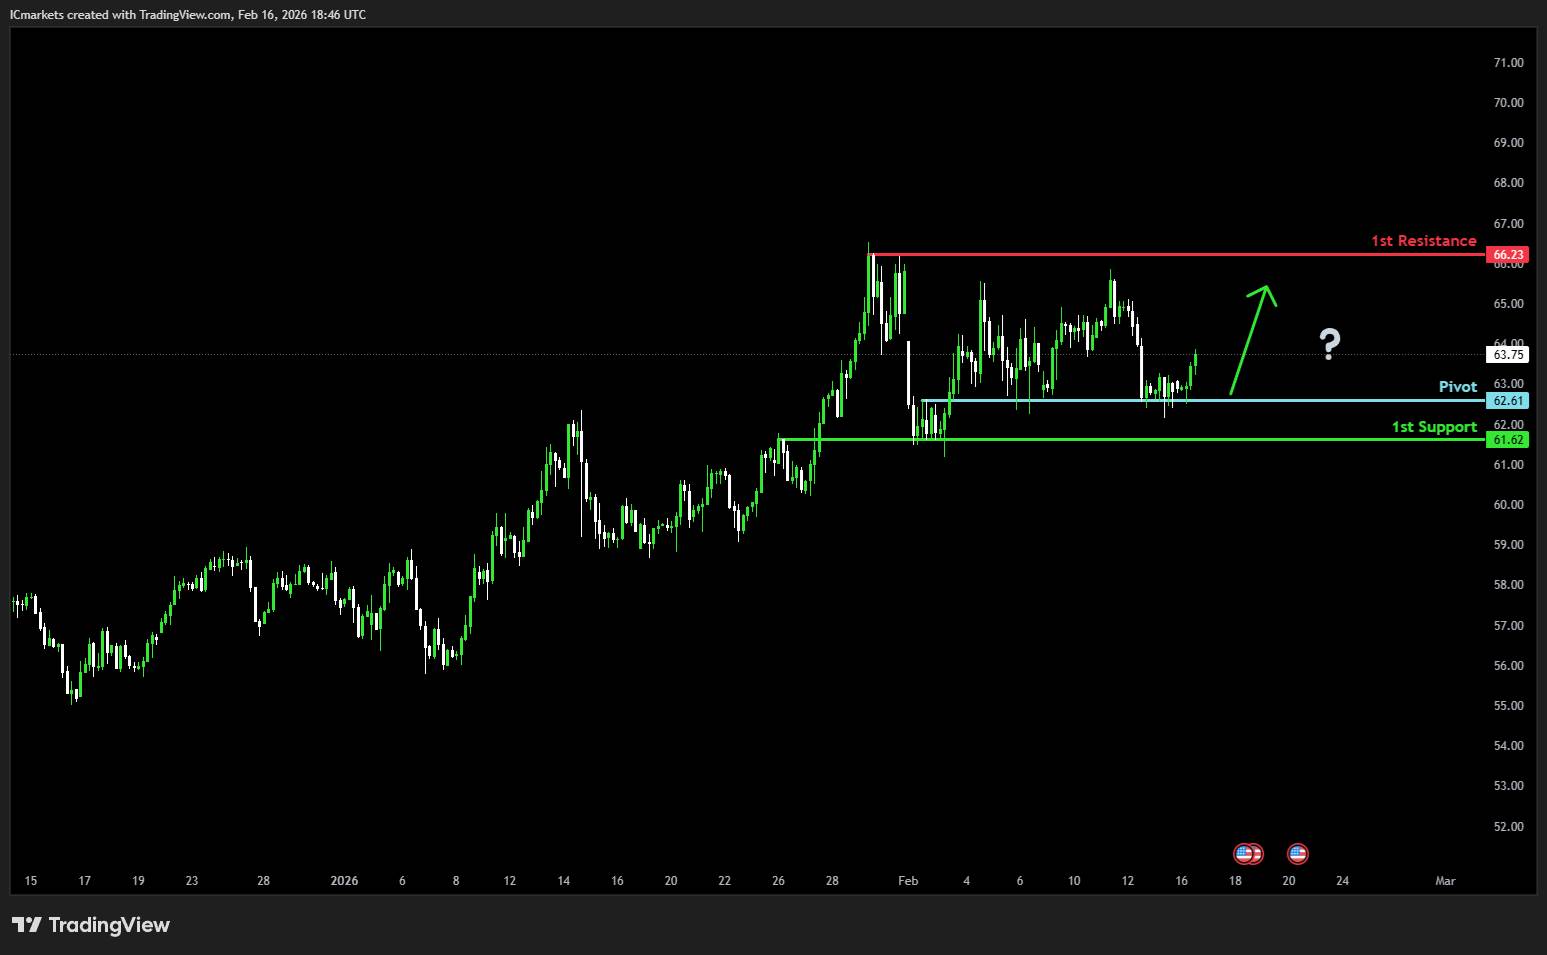
WTI/USD (Oil):
Potential Direction: Bullish
Overall momentum of the chart: Bullish
The price has already bounced off the pivot and may continue its bullish move toward the 1st resistance
Pivot: 62.61
Supporting reasons: Identified as an overlap support, where renewed buying pressure could emerge to push the price higher.
1st support: 61.62
Supporting reasons: Identified as an overlap support, indicating a key level where the price could stabilize once more.
1st resistance: 66.23
Supporting reasons: Identified as a swing high resistance, indicating a potential area that could halt any further upward movement.
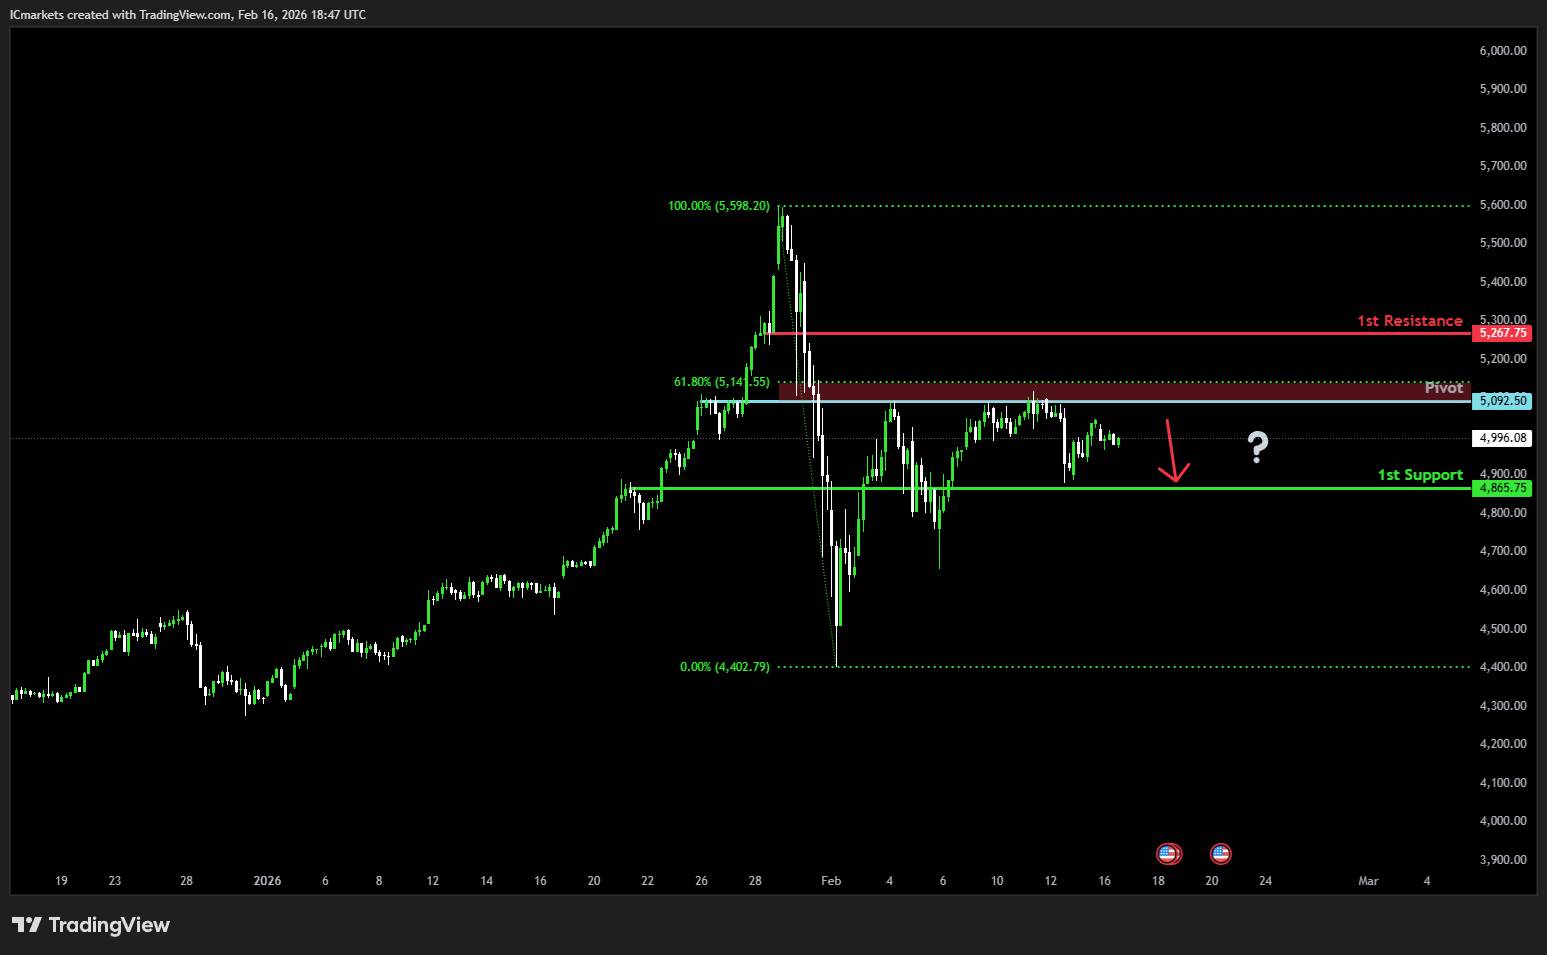
XAU/USD (GOLD):
Potential Direction: Bearish
Overall momentum of the chart: Bullish
The price could make a short-term pullback to the pivot and may continue its bearish move toward the 1st support.
Pivot: 5,092.50
Supporting reasons: Identified as a pullback resistance that is slightly below the 50%% Fibonacci retracement, where selling pressures could intensify and potentially cap any upward retracement.
1st support: 4,865.75
Supporting reasons: Identified as a pullback support, indicating a key level where the price could stabilize once more.
1st resistance: 5,267.50
Supporting reasons: Identified as a pullback resistance, indicating a potential area that could halt any further upward movement.
The accuracy, completeness and timeliness of the information contained on this site cannot be guaranteed. IC Markets Global does not warranty, guarantee or make any representations, or assume any liability regarding financial results based on the use of the information in the site.
News, views, opinions, recommendations and other information obtained from sources outside of www.icmarkets.com, used in this site are believed to be reliable, but we cannot guarantee their accuracy or completeness. All such information is subject to change at any time without notice. IC Markets Global assumes no responsibility for the content of any linked site.
The fact that such links may exist does not indicate approval or endorsement of any material contained on any linked site. IC Markets Global is not liable for any harm caused by the transmission, through accessing the services or information on this site, of a computer virus, or other computer code or programming device that might be used to access, delete, damage, disable, disrupt or otherwise impede in any manner, the operation of the site or of any user’s software, hardware, data or property.
The post Tuesday 17th February 2026: Technical Outlook and Review first appeared on IC Markets | Official Blog.